Not all duels are created equal, nor are they easy to adjust
It is 1694. Edward Wilson dies in a duel he asked for over the favour of a woman. It is 1804. Aaron Burr's shot tears through Alexander Hamilton's liver and into 21st century pop culture. It is an unknown year, close to the present. Someone decides to collect tackle data in a 'duels' framework.
It is 2021. I am writing this newsletter. All of these decisions are arguably regrettable.
I do not like defensive actions being organised as ‘duels’. I think that it’s a categorisation of defensive actions that doesn’t leave much room for a lot of defender-attacker interactions. What is a duel? It’s a contest between two parties, with a suggestion that each party is engaging equally. But when an attacker receives a ball and the defender, behind them, pokes it away from between their legs, is that a ‘duel’?
The point of a duel was also, in its early modern European form, for each side to be on a broadly equal footing. Rules were agreed upon and weapons were matched. But duels on a football pitch aren’t like this.
In the 2020/21 Premier League season, Christian Benteke was the forward who had the best aerial duel success rate (out of players who'd contested 50 or more, per FBref). He got just under 60% of his headers. However, a list of those with a better rate than him includes Andy Robertson, Thiago Alcántara, and Victor Lindelöf, none of whom are particularly known for their heading ability. There was a cigarette paper between Andy Carroll's success rate and Aaron Wan-Bissaka's. Sergio Reguilón was 'better in the air' by this metric than Aleksandar Mitrović.
Duel win percentage is one of the last remaining defensive statistics that I see commonly used as an indicator of quality. For things like tackle and interception numbers, a lot of people (wisely) use them to gauge style or role rather than quality, but duel success rate seems just so temptingly simple.
But simple it is not.
As far as aerial duels go, it's the long balls forward from goal kicks, free-kicks, or clearances that help defensive players out. With more defensive players than attacking players high up the pitch, defenders can delegate while attackers need to move, forcing them to take their eye off the ball and approach things from an awkward angle. They’re also usually aiming for flick-ons, where a jump that’s just too high is a negative; defenders just want anything on the ball, and can leap as high as they like.
Quite simply, its the same principle as for expected goals: not all shots are equal, and not all duels are equal either.
Dribbles and tackles (two sides of the same coin in many datasets) aren’t exempt from this principle either. Prospective tacklers are less likely to be dribbled past if they’re on the wing, and they have a higher likelihood of being dribbled past in the centre of the pitch.
This is shown in the image below, which I’m repurposing from an old post on a now-nonexistent blog. It uses data from StatsBomb's open dataset[1], and is comparing their Tackle and Dribbled Past events[2], split into a grid of roughly 9 yards by 9 yards. The size of each circle indicates the number of events in that zone, and the deeper the shade, the higher the tackle success rate. The range is from around 50-75%.
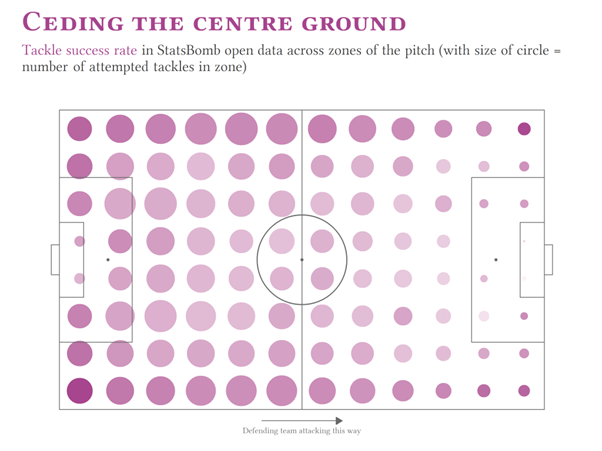 |
There’s an obvious reason why it’s harder to dribble past someone on the wings, and it’s the sidelines. As a defender, you can predict a winger’s movements more easily because they have fewer directions to go in. However, this means that comparing players’ tackle and dribble success rates will depend on what kind of tackles/dribbles they’re attempting.
Even for players in the same ‘position’ it might not be easy. One centre-back may have to cover for their full-back and make tackles by the sideline; another might be tasked with stepping forwards into midfield and try to make ‘trickier’ tackles in the centre of the pitch.
Unfortunately, the difficulty in digesting data doesn’t stop there. Here’s another repurposed image of mine using StatsBomb free data on where interceptions are made. A heavy concentration of them are made in very particular areas.
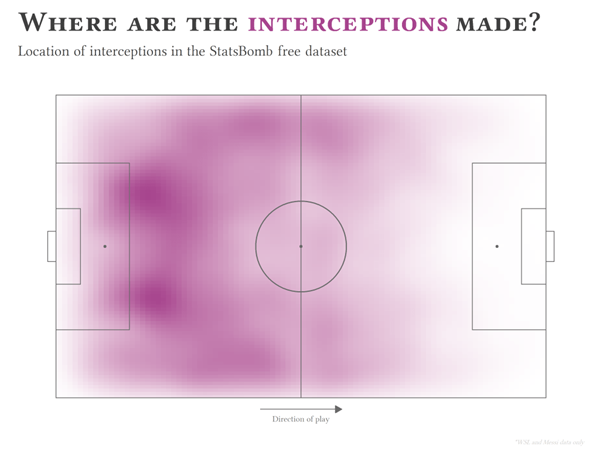 |
It therefore seems likely that the areas a player plays may affect how many interceptions they make. This doesn’t necessarily mean that it’s defenders making these interceptions. If an attack is high up the pitch, the defenders will often have retreated to deeper/narrower than these peaks of concentration. This might also mean that this visualisation is telling us something about the situations of interceptions too (or, potentially, just the way the data’s being collected!).
Subscribe to the newsletter for where football is heading, on and off the pitch
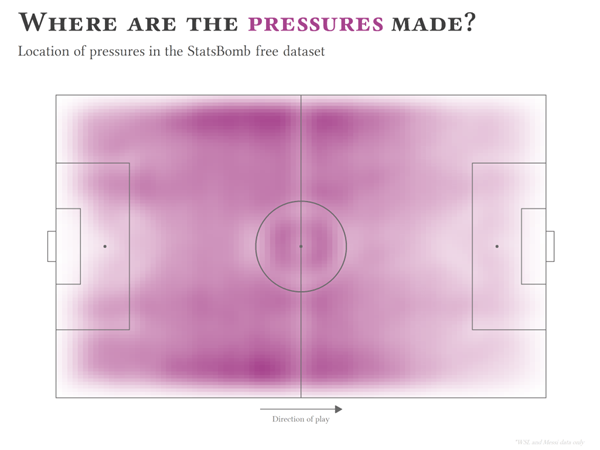
Similarly, pressures, like tackles (and for similar reasons), are more likely to be made by the sideline.
 |
So, how to deal with this.
You could choose to make ‘expected goals’-type models that account for factors like position on the pitch, but you might also think that is overkill. Specifically on duels, there are other ways of modelling them. You can try and place values on the individual duellers' ability, which will likely take part of the above positional effects into account, though probably not all, but might give a better picture than modelling for position on the pitch alone.[3]
As far as the ‘counting stats’ (number of tackles or dribbles made) go, ‘possession adjustment’ is a well-worn option too. I wrote a few blog posts on the same now-nonexistent website as I took the above data visualisations from, so allow me to repurpose some of it.
There are smatterings of work out there on various forms of possession adjusting. A piece from Mike Goodman in 2013, this on American Soccer Analysis in 2014, this from Ted Knutson later that year. They're surprisingly varied, and if you're interested in this topic then they offer a range of ideas to draw from.
One of these ideas was that, by adjusting for a team’s share of possession, you could get a more reflective number of a player’s defensive actions. The rationale is that players on teams with low possession have more opportunity to defend, so they might have defensive stats that are inflated by this (and vice versa). Adjusting for possession share, in theory, levels the playing field.
I have long had my doubts though, and wrote more about my quibbles with the theory at more length in another newsletter essay. But if we're possession adjusting defensive stats because we think players on teams with low possession naturally make more actions, we should at least check.
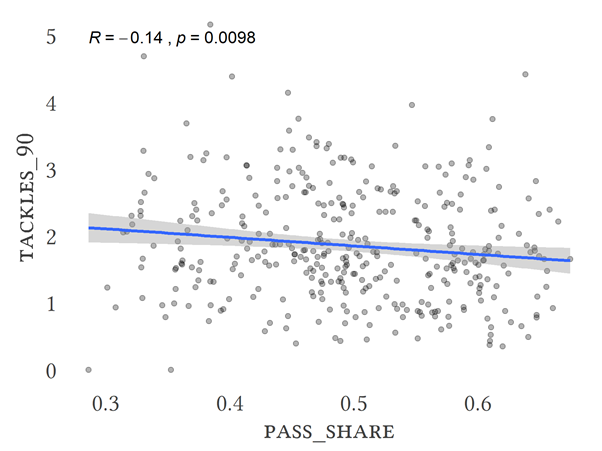
When I did this analysis, I only used the two seasons’ of WSL data that StatsBomb had in their open dataset. I figured that the Barcelona data in the Messi career dataset would, with the Catalans’ possession-heavy style, skew the results. For the method, I took the share of passes that a player's team had when they were on the pitch, and got a basic correlation between that and the number of defensive actions per 90 minutes that the players made. Goalkeepers were filtered out because they’re a particular exception.
What you would expect to see if you wanted evidence in support of possession adjusting would be a general trend where the action per 90 minutes goes down as pass share goes up. This does happen, though quite lightly.
 |
 |
 |
 |
Now, back in the day (circa late 2014), I experimented with a kind of possession adjusting of my own. I was working exclusively on central defender statistics at the time (as I was copying numbers into Excel by hand), and just using possession didn’t make sense to me. Players like Chelsea’s John Terry and Gary Cahill played on a team that had quite a lot of the ball, but they still didn’t do much. So I decided to factor in the number of shots on target and shots blocked that centre-backs were on the pitch for too, as a proxy for ‘work they might actually be involved with’.
I don’t think it was a good method. But I do think it was good thinking. As I would later find out when doing the pass share correlations, the picture looked different for different positional groups.
To start small and make things easier to digest, I split players into broad ‘defender’, ‘midfield’, and ‘forward’ categories. As far as tackles went, pass share seemed to make no difference (in this limited sample size) for midfielders, but it had a slight effect for defenders and forwards.
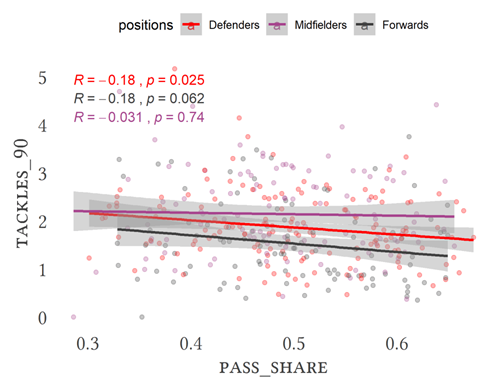 |
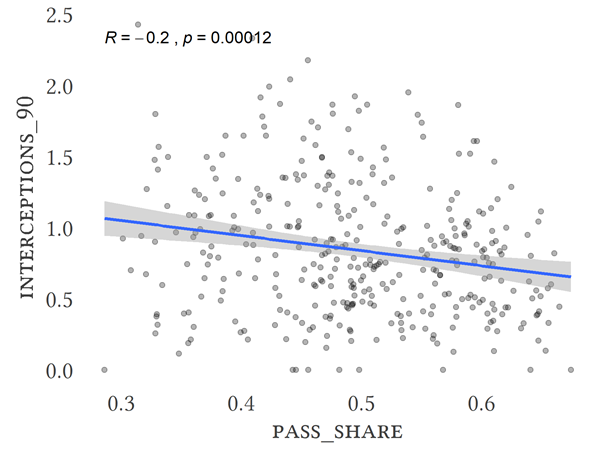
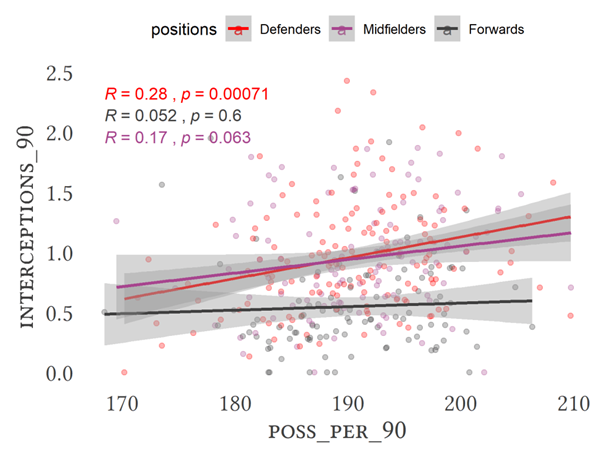
For interceptions, again not much for midfielders but seemingly some signal for defenders.
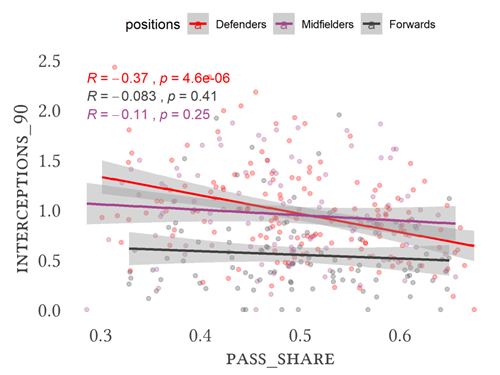 |
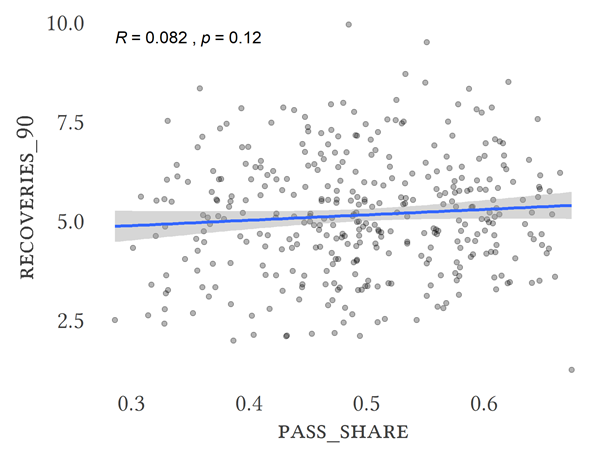
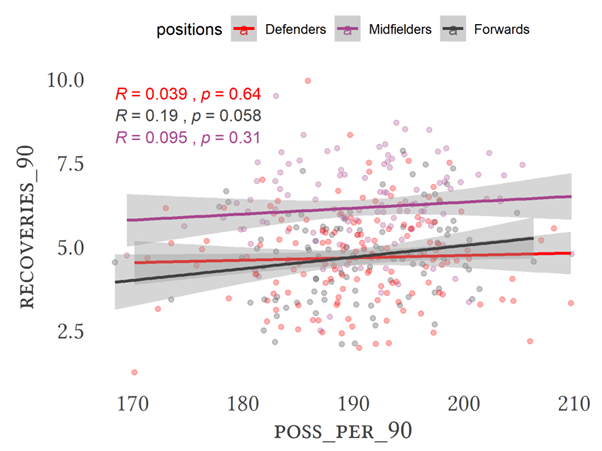
The previous graph for recoveries showed the opposite effect to possession adjustment theory’s expectation: a rise with pass share. This is because the way recoveries are defined in StatsBomb’s data (and some other data providers’ data) necessitate the team keeping the ball for a given number of passes for it to count. However (again though, small sample size), this seems more true for defenders and midfielders than forwards.
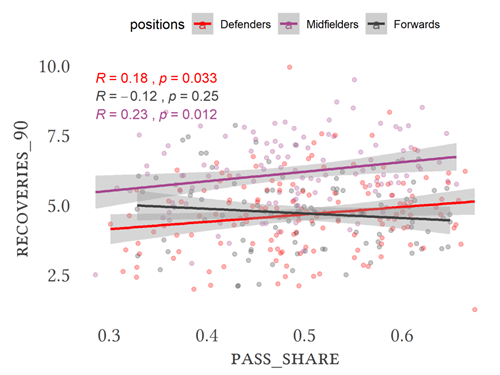 |
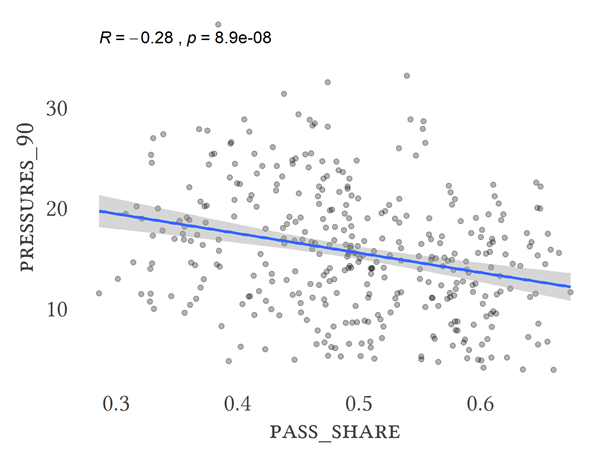
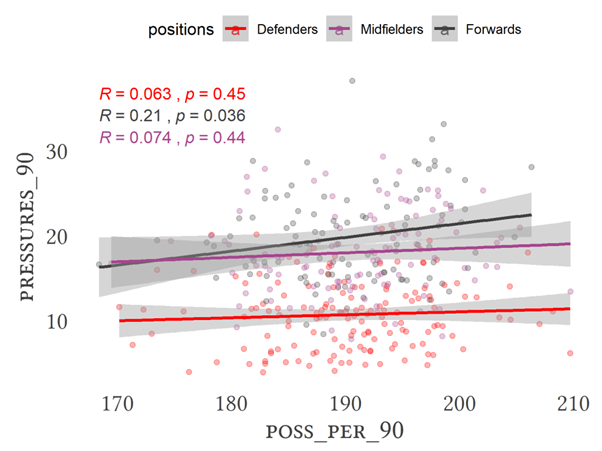
And finally, pressures, where each positional group had a similar trend. This is the least surprising. You could, hypothetically, make an infinite number of pressures without winning the ball back, meaning you can keep adding pressures for as long as you don’t have the ball. For other types of defensive actions, you usually interrupt the opposition’s possession by making a tackle, so the theory about ‘increased opportunity with lower possession share’ may not quite work.
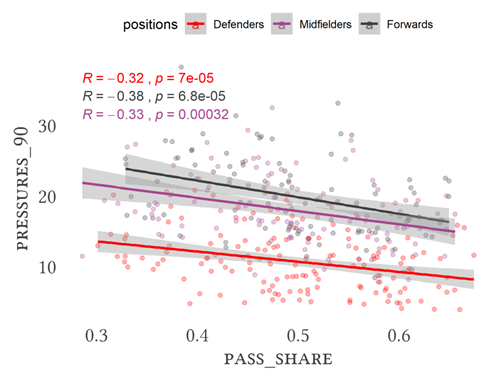 |
This method of possession adjusting isn’t the only one though. As well as pass-based possession, there are ‘possessions’, plural – spells of possession where one team or another had a ball. In this methodology, a string of two passes and a string of ten passes both count as a single ‘possession’.
Got this far? You'll probably want to subscribe to the newsletter
If we go back to the theory of possession adjusting briefly, that defenders who have more opportunity to defend will ‘unjustly’ have higher defensive stats, adjusting for the number of possessions may make sense. A bitty game, where neither team holds onto the ball for long, would surely see increases in things like tackles or interceptions etc.
I did some correlations for that too.[4] The trend we’d be looking for here, to support adjusting per-possession, would be tackle numbers going up alongside number of possessions per 90 in matches a player played in.
For tackles, it was a more distinct trend for midfielders than other positions, but a very slight upwards relationship for all.
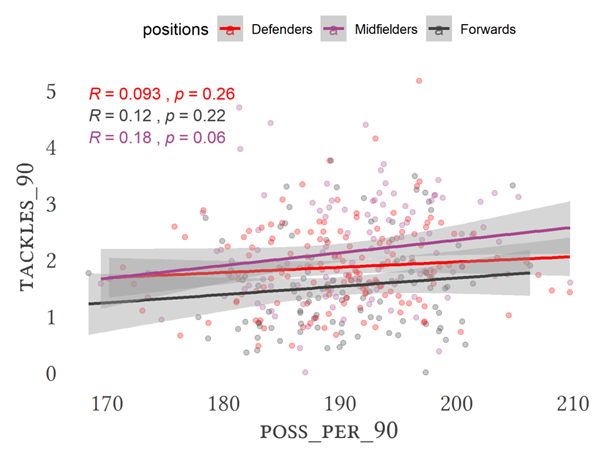 |
For interceptions, it seemed to make no difference for forwards (although again: sample size), but seemed to be some kind of light signal for midfielders and defenders.
 |
Recoveries is the weird odd one out again
 |
And this time the trends for pressures looks more similar to the trends for recoveries than anything else.
 |
I present these not as definitive takeaways to apply to your own work, but to show whether possession adjusting makes sense depends on both the stat and the position of the player.
My current opinion on possession adjusting is that this kind of complication may not make it worth it, but each to their own. I echo Ashwin Raman’s tweet about how an extra layer of abstraction might make it difficult to work out whether the adjustment is working or not:
So yeah, basically, tl;dr: be wary of more complex forms of adjustment, because they can often be less useful than simpler adjustments because of the harder-to-contextualise skewed numbers.
— Ashwin Raman (@AshwinRaman_) August 25, 2021
That’s my opinion though, and for those working in the professional industry, it might be worth trying out some adjustments. But it’s important to know:
- That possession adjusting worthiness can change by position and stat
- That duels can be easier in some areas and situations than others
- That I prefer the duel songs in Hamilton more than using duels and tackles as synonyms, and the duel songs in Hamilton are some of my least favourite.
Read this information; absorb this information; go forth and stat.
If you've enjoyed this, please consider passing it along to someone you think will find it interesting
[1] “It uses data from StatsBomb's open dataset“ || WSL and Messi data only. I can’t remember why I only used that data, but it is what it is.
[2] “…comparing their Tackle and Dribbled Past events…” || There will also be tackle attempts under Foul events, but I couldn’t work out how to separate out just the ones that would be applicable here.
[3] “There are other ways of modelling duels by trying to get each dueller’s ability – this will likely take part of the above positional effects into account, probably not all, but might give a better picture than only modelling for position on the pitch.” || This actually seems like a fun, if pretty technical, research project - which is the bigger influence on duel success: circumstance or dueller ability?
[4] “I did some correlations for that [possessions adjusting] too.” || I don’t seem to have kept a note of how I defined my possessions, but I don’t think that methodology should matter too much.