High-fat data for low(er)-fat costs
Science can do many things, and soon it may be able to make low-fat chocolate that doesn't taste of bland disappointment. The outside of a piece is the most important for the texture, and humans get fooled pretty easily about taste-related things. So feasibly you could coat low-fat fauxcolate with high-fat chocolate and not be able to tell the difference. Even if you could tell the difference, the drop in fat and calories and stuff might be worth it. Who knows.
It's taken me a while to get around to playing with StatsBomb 360 data. There's been some interesting stuff that people have done with it, like identifying line-breaking passes or analysing on-ball positioning. The company's senior analyst Jaymes Monte looked at space that receivers got the ball in earlier this year. Many of the research papers at the 2022 StatsBomb conference featured explorations of this newly-available type of data. But I'd never touched it. What kind of analytics newsletterer does that make me, for shame.
Then I stopped thinking about individual stats and thought about team shape. The shape itself seemed to present a problem: the StatsBomb 360 frames don't give you identifiable player information, just the team, whether they're the player making the action, and whether they're the goalkeeper. Beyond that a left-back looks like a centre-forward. Now I had a challenge: can you identify player positions from the freeze-frames in a way that lets you look at team shape.
Before I go further, I'd have found this obstructively difficult if it wasn't for StatsBomb's statsbombpy Python package and the mplsoccer package. They're the real MVPs.
I'd also have struggled were it not for remembering Laurie Shaw and Mark Glickman's paper from a few years ago, 'Dynamic analysis of team strategy in professional football'. That piece of work was about determining team formations from tracking data, identifying changes in formation, differentiating between attacking and defensive formations.
Slight difference: they had the positions of all 22 players. In the match I chose to work with, I had an average of 13.
However, Shaw and Glickman wanted to designate formations, but I was happy to use StatsBomb's and just try and assign players within that. I only looked at the off-ball team, for two reasons: 1) in my experience a team's out-of-possession shape is often closer to the noted formation than their in-possession shape 2) it's the out-of-possession shape I was interested in anyway.
Let me copy and paste wholesale the part of the paper I found most useful:
The final spatial distribution of the outfield players is determined by the following algorithm: first, we set the centroid of the formation to be the position of the player in the densest part of the team, as determined by the average distance to the third-nearest neighbour. We then identify the relative position of his nearest neighbour, the relative position of that player’s nearest neighbour (ignoring any player already considered in the process) and so on, until the positions of all players in the team have been determined.
Or as a tl;dr, as Shaw and Glickman write in the following paragraph: "[T]he location of a player in a formation is dictated solely by his position relative to his neighbouring teammates."
There are probably a raft of smart, technical ways to do this. But I'm doing this in my free time so we're getting the cheap and easy way. First: Make some fake data for a formation (goalkeeper at (1,4); right-back at (3, 1); RCB at (3, 3); etc). Second: code a long iteration sequence that compares the angle of a 360 frame datapoint to all the teammate datapoints, and compares those angles to the corresponding angles of all the possible options in the fake formation data. The former is easier to understand than the latter.
For example: imagine a point floating near the halfway line on the right flank, with another six teammates in shot. That's six angles. Let's go to the right winger in our fake data. Compare the first of the six angles to the ten angles that the fake data winger has to its teammates. Look for the smallest difference in degrees. What you have there is the hypothetical "if this 360 frame datapoint was the right-winger, the angle is closest to this second datapoint being the defensive midfielder". Repeat that for all of the possible combinations, choosing the smallest difference in angles each time.
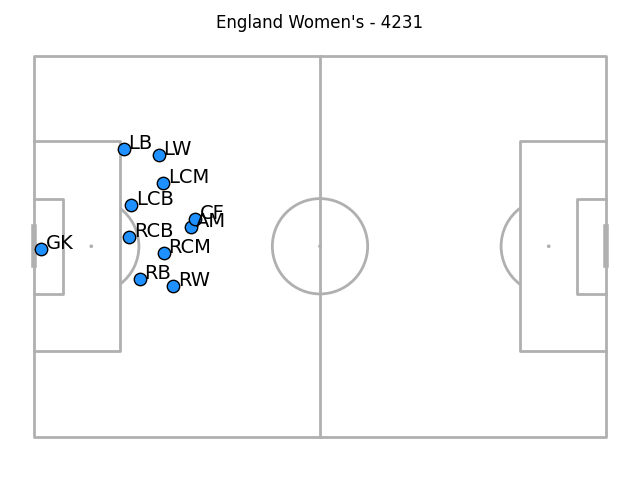
The results, it's fair to say, aren't perfect. Here's a particularly bad example, the out-of-possession team in blue and defending the goal on the right (where the goalkeeper* is). England, the defending team, are playing a 4-2-3-1.
NB: Player, position, and team name come direct from the data
*Because StatsBomb do note whether a player is a goalkeeper or not, we can be sure that we get these right, as well as avoiding falsely labelling an outfielder as a goalkeeper.
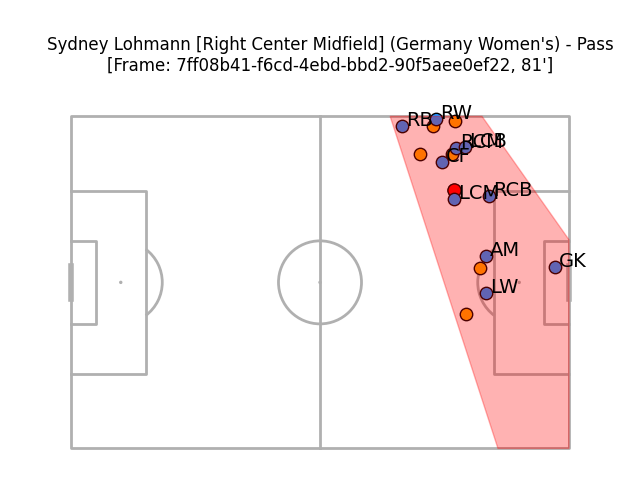
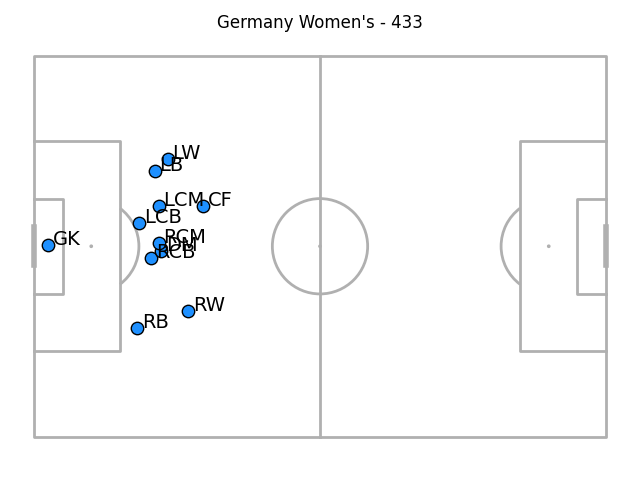
And another example (this time with Germany defending in a 4-3-3):
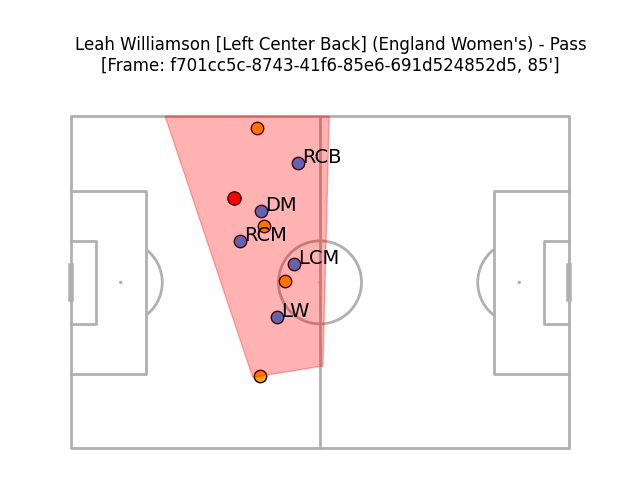
I didn't include any information other than the defending team's locations in these calculations, so there's no knowledge that the England player on the ball is their centre-back Leah Williamson. That makes it somewhat unlikely that the blue dot closest to her is the defensive midfielder, as the algorithm has labelled it.
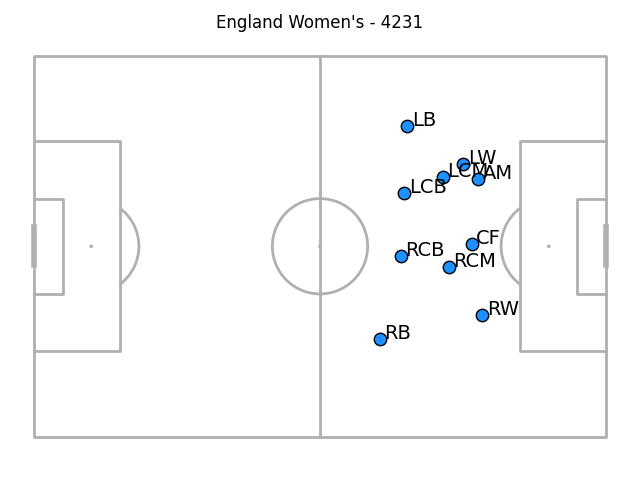
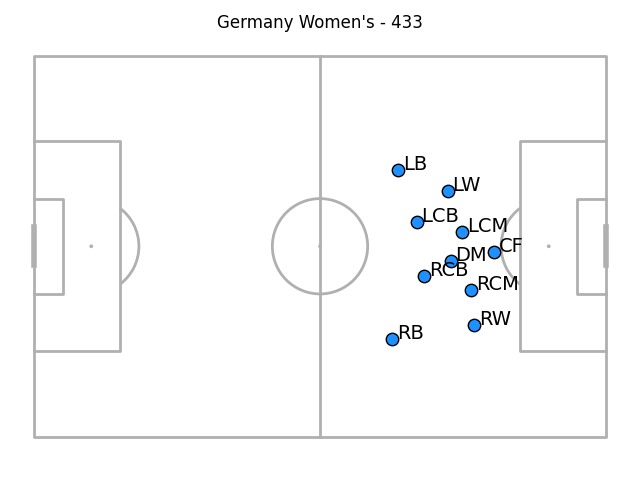
However, it's not all bad. Germany are back defending in this next example, still in their 4-2-3-1. I don't quite think it's labelled every point correctly*, but it looks a lot more plausible.
*I think that what's been labelled as the LCM should be the left-winger and that what's been labelled as the DM should be the left-sided centre-back, with the RCM and DM shuffled to the right, out of the frame's viewable area.
I suspect that this could be improved if you focused just on passes and took the pass and ball receipt together, as this probably increases the viewable area. On the other hand, that would mean you have to deal with 'tracking' datapoints across two frames. Shrug.
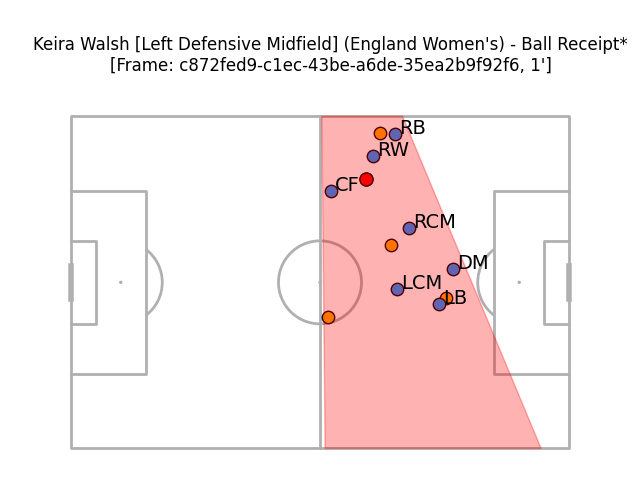
If you take the average of the frames though, things don't look too awful. (This time the defending team are defending the goal on the right, for no reason other than inconsistency in plotting between my code files).
There's a problem with the goalkeeper, mind: because they're in so few frames we only see them very close to goal. It's also possible that because we know which datapoints they are/aren't, they're not pulled towards the rest of the bunch by false labelling. I also think the full-backs are a little weird, but don't have a strong theory as to why the weirdness occurs.
Still, you can segment the data a little in interesting ways. Here are the two teams when their opponents had the ball in the final third:
And out-of-possession positions for when the opponent were making on-ball actions in their defensive third:
The goalkeeper and full-back weirdness persists through each of these segments to my eye (not least because the goalkeeper isn't recorded at all for these high defensive positions). In these latest two images, the full-backs have a tendency to be deeper than the centre-backs as well as being wider than the wingers - I suspect that's a function of camera angling only catching centre-backs when they're in very advanced positions and them being absent otherwise. Maybe a future step in this process could be estimating out-of-frame positions.
Anyway, this doesn't seem bad for some quick work on a single game. Maybe things would look more robust if the averages were over a couple of matches' worth of data.
However, part of me also wonders whether the plausible-ness of these averages might be a bad thing. If it looks 'kinda right' might that give a false sense of security in trusting it? I don't have tracking data to hand to compare this to, and maybe it's totally wrong! It looks close enough to fool you though, and one's biggest fear should always be unleashing a plausible idiot ChatGPT-alike onto the world.
If that's the case, at least it's wrong enough to appear not-too-useful. Out of possession average positions might be useful for getting a sense of compactness, or maybe whether a winger is allowed to stay high rather than tracking back, but the fact that there's clear labelling error going on in this means you can forget that. The only insight I feel vaguely safe drawing from these images is that Germany probably defended a little higher than England. (A quick check of the data shows me that they did indeed have more pressures in the final third than the winners of the Lionesses, so looks like that is correct).
All of this becomes moot if StatsBomb add individual player ID to their 360 data, although that hasn't as of yet been announced. This might be slightly flawed, it might not be hugely useful, but then neither is low-fat fauxcolate coated in high-fat chocolate shells. But if you're able to do them right, maybe they could be low-key game-changers, for a certain audience at least.
Get Goalside is just about the only place you can get this kind of work. If you like it, you can become an official supporter for just £2 a month.
Thanks again to the StatsBomb's statsbombpy Python package, the mplsoccer package, and 'Dynamic analysis of team strategy in professional football' paper, they're all worth checking out. Each helped make this a relative breeze. StatsBomb's open data repository can be found here.