Time to give ball-in-play measures a kick into touch?
In Sunday school, as a child, we were taught that God loves all His creation in all its diversity, from the lowliest frog to the highliest mountain goat, whether they be big or small, beautiful or not. But FIFA is not God.
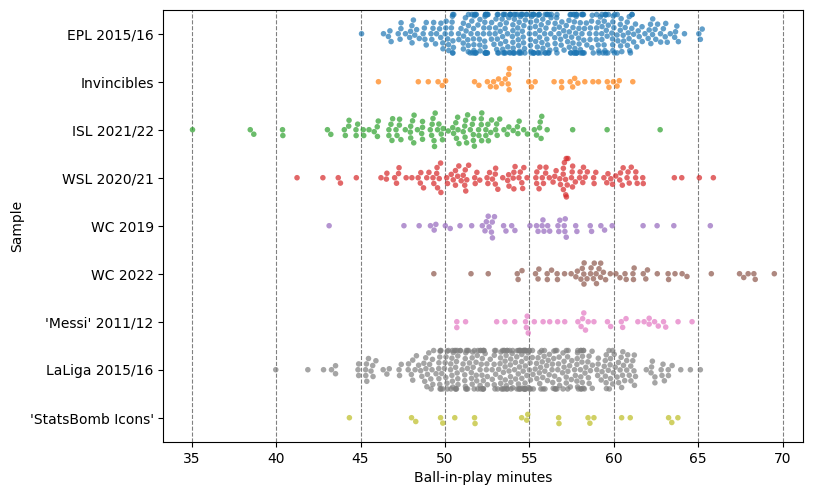
There's a diversity of ball-in-play times in football, and football authorities do not seem to love it. As we talked about in the first newsletter on ball-in-play time, matches appear to drift towards an average of 54-56 minutes, within each average is a pretty wide range of ball-in-play values. Many of the sample competitions that we looked at last time had matches with around 45 minutes of in-play time (sometimes called 'effective time'), stretching all the way up to 65. Take a look below: every dot is a single match.
What causes these differences though? Why do some matches have a lot more ball-in-play time than others? Why is it apparently perfectly normal for the in-competition range to be ten minutes or more?
That's the thing I've been looking at, and I, simply put, have a stupidly lowly frog-level thing to say about it.
If the ball doesn't go out of play, the in-play time is higher.
That's what it seems to boil down to. Lemme take you through it.
Subscribe to the newsletter and demystify football in your inbox
In, out, in, out, shake it all about
After the first newsletter, the first thing I wanted to look at was the ball-in-play time for different teams alongside some 'stylistic' statistics. It was kinda boringly predictable though: as a trend, high-possession teams with lots of short passes were involved in matches which, on average, had a higher amount of ball-in-play time.
This was fun and all, but felt like distracting from the point. So let's go right back to basics.
The charts below have four statistics which are compared with the ball-in-play time of all matches I ran my code on. They are:
- Short passes: the percentage of passes which were 15 metres or shorter
- Ground passes: the percentage of passes which were along the ground
- Live passes: the percentage of passes which were 'live' (so, not goal kicks, free kicks, etc)
- Restarts per minute of ball-in-play time
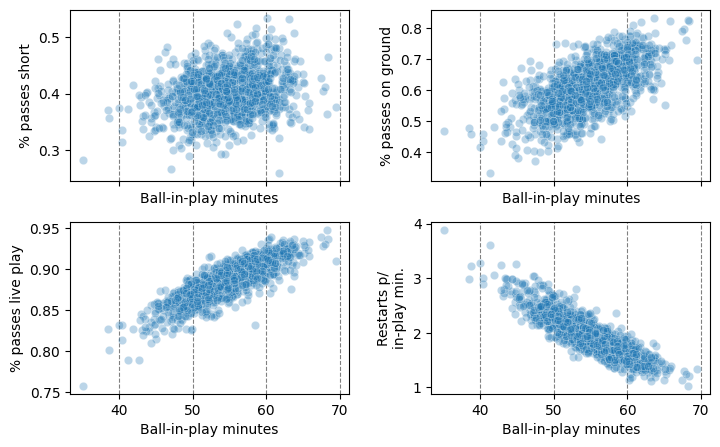
There doesn't look like much of a correlation between a match having lots of short passes (top left) and its ball-in-play time, across these samples of data anyway. (That might just be about the particular cut-off point of 'short'). There's more of a link when focusing on passes along the ground (top right), although still with quite a wide range.
That brings us to the two charts on the bottom row, '% of passes live' and 'restarts per in-play minute'. In a way, they both represent the same type of data: how many passes are in live play compared to being a dead-ball restart. I read them both as saying 'more restarts/stoppages means less in-play time'. After all, this makes sense: if the ball doesn't go out of play then the 'in-play' timer just keeps ticking up and up and up, even if nothing much is really happening.
Let's look at this in its purest state then, with the total number of restarts for each match compared to the in-play time. The link is a little fuzzier than some of the previous charts, but it's still clear:
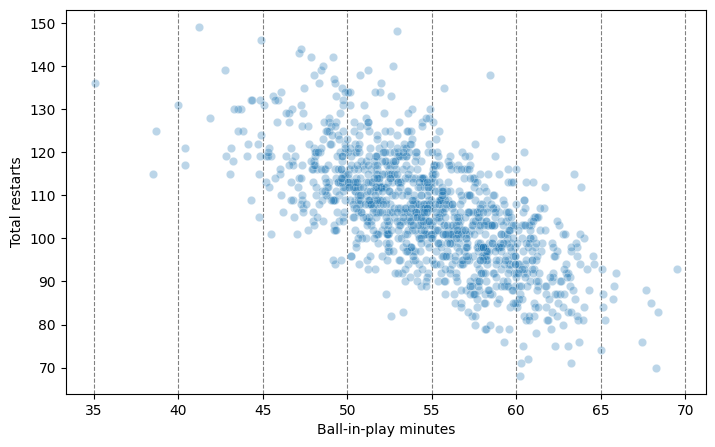
This restart correlation might even explain the link between ground pass proportion and in-play time, although my intuition is that any meaning in the link is actually about high passes:
- restarts like free-kicks and goal kicks and throw-ins tend to be high passes
- high passes are less controlled and therefore probably more likely to bounce out of play (possibly also having longer stoppages as teams collectively move up or down the pitch to follow the long path of the ball).
The link between number of restarts and in-play time is always going to be a little fuzzy. The stoppages between the restarts can vary in length, meaning two matches can differ in in-play time even with the same number of stops, and the length of added time to make up for excessiveness of breaks will also vary. But, yeah - this is a pretty plausible and stupidly simple link.
Subscribe to the newsletter and demystify football in your inbox
What this means...
We've done the data, now we're going to do the semantics.
There's a way of describing football that says that if the ball is in play it's 'live' and if it's not, or if the play hasn't been restarted yet, it's 'dead'. I re-watched half an hour of the 2018 men's World Cup 3rd-place match between Belgium and England to check that data and, believe me, in-play football can be dead.
If you think I've been banging away at this, Twenty First Group have also called the added time push 'a sledgehammer looking for a nail'. And Omar Chaudhuri there reaches a similar conclusion that I do:
"The single biggest driver of effective playing time is the on-field technical quality of play – not time wasting, as is commonly believed. This is why the Premier League has 15% more ball in play time than League Two, and the Champions League 5% more than the Premier League. Better players and teams keep the ball in play."
I'm inclined to believe that there's a tactical choice element as well, but the tactical choices to play ground pass-based, keep-ball football only become unlocked when technical, spatial, and pitch-quality levels are good. (That said, high-quality pressing may still disrupt this).
I don't think it's too far over the line to say that a continued push to increase ball-in-play time beyond levels we have historically seen in football risks casting certain styles of play as illegitimate. If you want a guaranteed 60 minutes of the ball in play (something that appears to be more uncommon than common historically in football, even at the highest level) then what you do not want is the ball to go out of play.
A smarter approach - although an investigation that may be difficult with data taken from TV broadcasts - would be to look at the average time that certain stoppages usually take. There'll be a range for throw-ins, a range for long goal kicks, short goal kicks, corners, goals. There may be important effects for high-physical intensity matches. If the length of time of goal-kick stoppages is increasing compared to matches of similar intensity and exertion from five years ago, then we can talk. But ball-in-play time is a clumsy, flawed - and possibly tactically geo-engineering - measure to use.
Epilogue
Hidden amongst this is a convincing argument that I think organisations like FIFA or the Premier League could be making. While the work I've done hasn't established any causal links, it seems fair to assume that better technical, tactical, and pitch quality could lead to more control-seeking in-possession play, which could in turn lead to fewer stoppages. Seen this way, you could argue that although present-day ball-in-play time isn't that different to historic figures, you would expect it to be higher based on increased quality across the board. In this argument, it's not that the line is going down, it's that it should be going up but isn't.
I still think there's a hole in that. Defences are better technically, tactically, and physically now too. Football is always a combative sport. We're already seeing how an increased focus on pressing strategies, varieties, trigger moves, and mid-block organisation is nudging Premier League teams into embracing The Long Ball, albeit in a much more controlled form than two or three decades ago.
There's one place where I do empathise with footballing authorities though: tactical injury time-outs. Player welfare means you can't just ignore it when players go down injured to disrupt their opponent's rhythm and let the coach give out some instructions, but it's also a joke at this point (literally, in WSL-watching circles). This - more than time-wasting at goal-kicks, say, which already has clear punishments referees can issue - is an area that probably needs addressing and will be awkward to do so.
I hope to make the rest of the code for this piece available before the end of September. The code for the first newsletter is already available in this GitHub repo. In the meantime I hope that the ridiculous aspects of this new push die down and that maybe some footballing authorities publish their own data, preferably over different timespans and different levels of football.
Remember: football is a lot like life, everybody needs to rest at some point.
Mea culpa, and data checks
Doing further research for this piece I got even more curious about what my code said were very long ball-in-play times for the 2018 men's World Cup. I re-watched the 3rd-place match between Belgium and England (the highest figure in the data produced by my code), taking notes on breaks. It was not a scintillating watch. It also didn't seem to stack up to the numbers I'd produced.
When I checked the event data event-by-event, I realised something I should have gone actively looking for beforehand: events missing when the TV broadcast was showing replays. This was a particular flaw in my methodology - a goal missing a kick-off due to replay meant I never went back to look for the duration of the stoppage (and wouldn't have got an accurate reading anyway).
I watched part of the 2019 World Cup final alongside the event data too to check StatsBomb's more recent data version, which it turns out every sample other than the 2018 World Cup one was collected under. Their documentation online indicates that they changed a bunch of stuff between these versions, and between these checks, previous checks, and the fact the 2018 average values were such a clear outlier in the previous newsletter, I am willing to trust the legitimacy of the rest of the data. But I've chucked out the 2018 World Cup stuff.