The Who, The What, and The Why of bringing advanced stats to the public
Get Goalside is returning to a regular schedule for the new season. A new newsletter will go out (at least) every other Thursday. early October sees a couple of big analytics events so there may be an extra one or two that month.
As far as false dichotomies go, the separation of arts and sciences is one of the big ones. From Ada Lovelace to Apple to the symbiotic relationship between the sci and fi in sci-fi, it’s not only unhelpful but ludicrous to drive a barrier between the two.
In the same way, the dichotomy between ‘proper football’ and ‘analytics’ is a false one too. In fact, that’s practically old news, an argument that’s long been settled. Football clubs want to win, and they’ll use whatever helps them, regardless of where it comes from (although sometimes with some scepticism and lack of enthusiasm).
But the media doesn’t need to ‘win’. The websites and magazines that we read, the coverage that we watch and listen to, doesn’t need to worry about correlations and robustness studies. The people who do worry about those things sure think that advanced stats are neat and useful though, and like telling other people about them. So how do you mix the two?
The Why
“There’s always a desire to place narrative and analytics in opposition to each other and I just don’t think that that’s true,” Mike Goodman, soccer editor for CBSSports.com, tells me. “My belief about using numbers and stats and analytics in media is, ‘we do want to tell stories but we want to make sure that the stories we’re telling are correct’.
“And what analytics does is it just gives you the tools to make sure that the stories you’re telling are right.”
For purposes of this newsletter, I’ll be using ‘advanced stats’ – rather than ‘stats’ or ‘analytics’ or something else -- as my catch-all term. I’m talking about not just expected goals, but things like possession sequences or progressive passes too. Anything that you could say is numerical and new to most fans in the past couple of years, things that are newer than things like shots, shots on target, possession percentages.
And some of these things certainly are still new to a lot of people. While it’s over half a decade since Arsène Wenger first started namedropping expected goals, the mention of xG can still get an amused “uh-oh” on national radio. Why do we persist in trying to use them?
“I think in most instances it’s because they fill a gap that other metrics can’t fill,” Tom Worville, Football Analytics writer at The Athletic, tells me, before going on to echo Goodman’s point. “I also think it comes from people demanding more from their football content. A talking-head ex-footballer seemingly isn’t enough. They want facts at times, not just opinion. Fancy stats can be a good bridge for that.”
As well as that, there’s a two-way relationship with how fans experience a game. “If a stat, whatever it is, highlights the way a game’s gone, or reveals something, and is easily explained – with that being key – then I think it would be used,” Matt Cheetham, a football statistician at Sky Sports, tells me.
“For us,” Cheetham said, “it’s all about how easily it can be understood, especially if appearing on screen for 5-10 seconds. During a game, you want stats to accentuate a trend in the game that people are seeing – can we highlight that further, with numbers.”
“We probably want to calibrate our metrics to measure the things that fans clap in the ground,” says Worville. “If we as people can recognise a situation and “reward it” (through clapping) then our stats should be able to measure and reward these players and teams too.”
The What
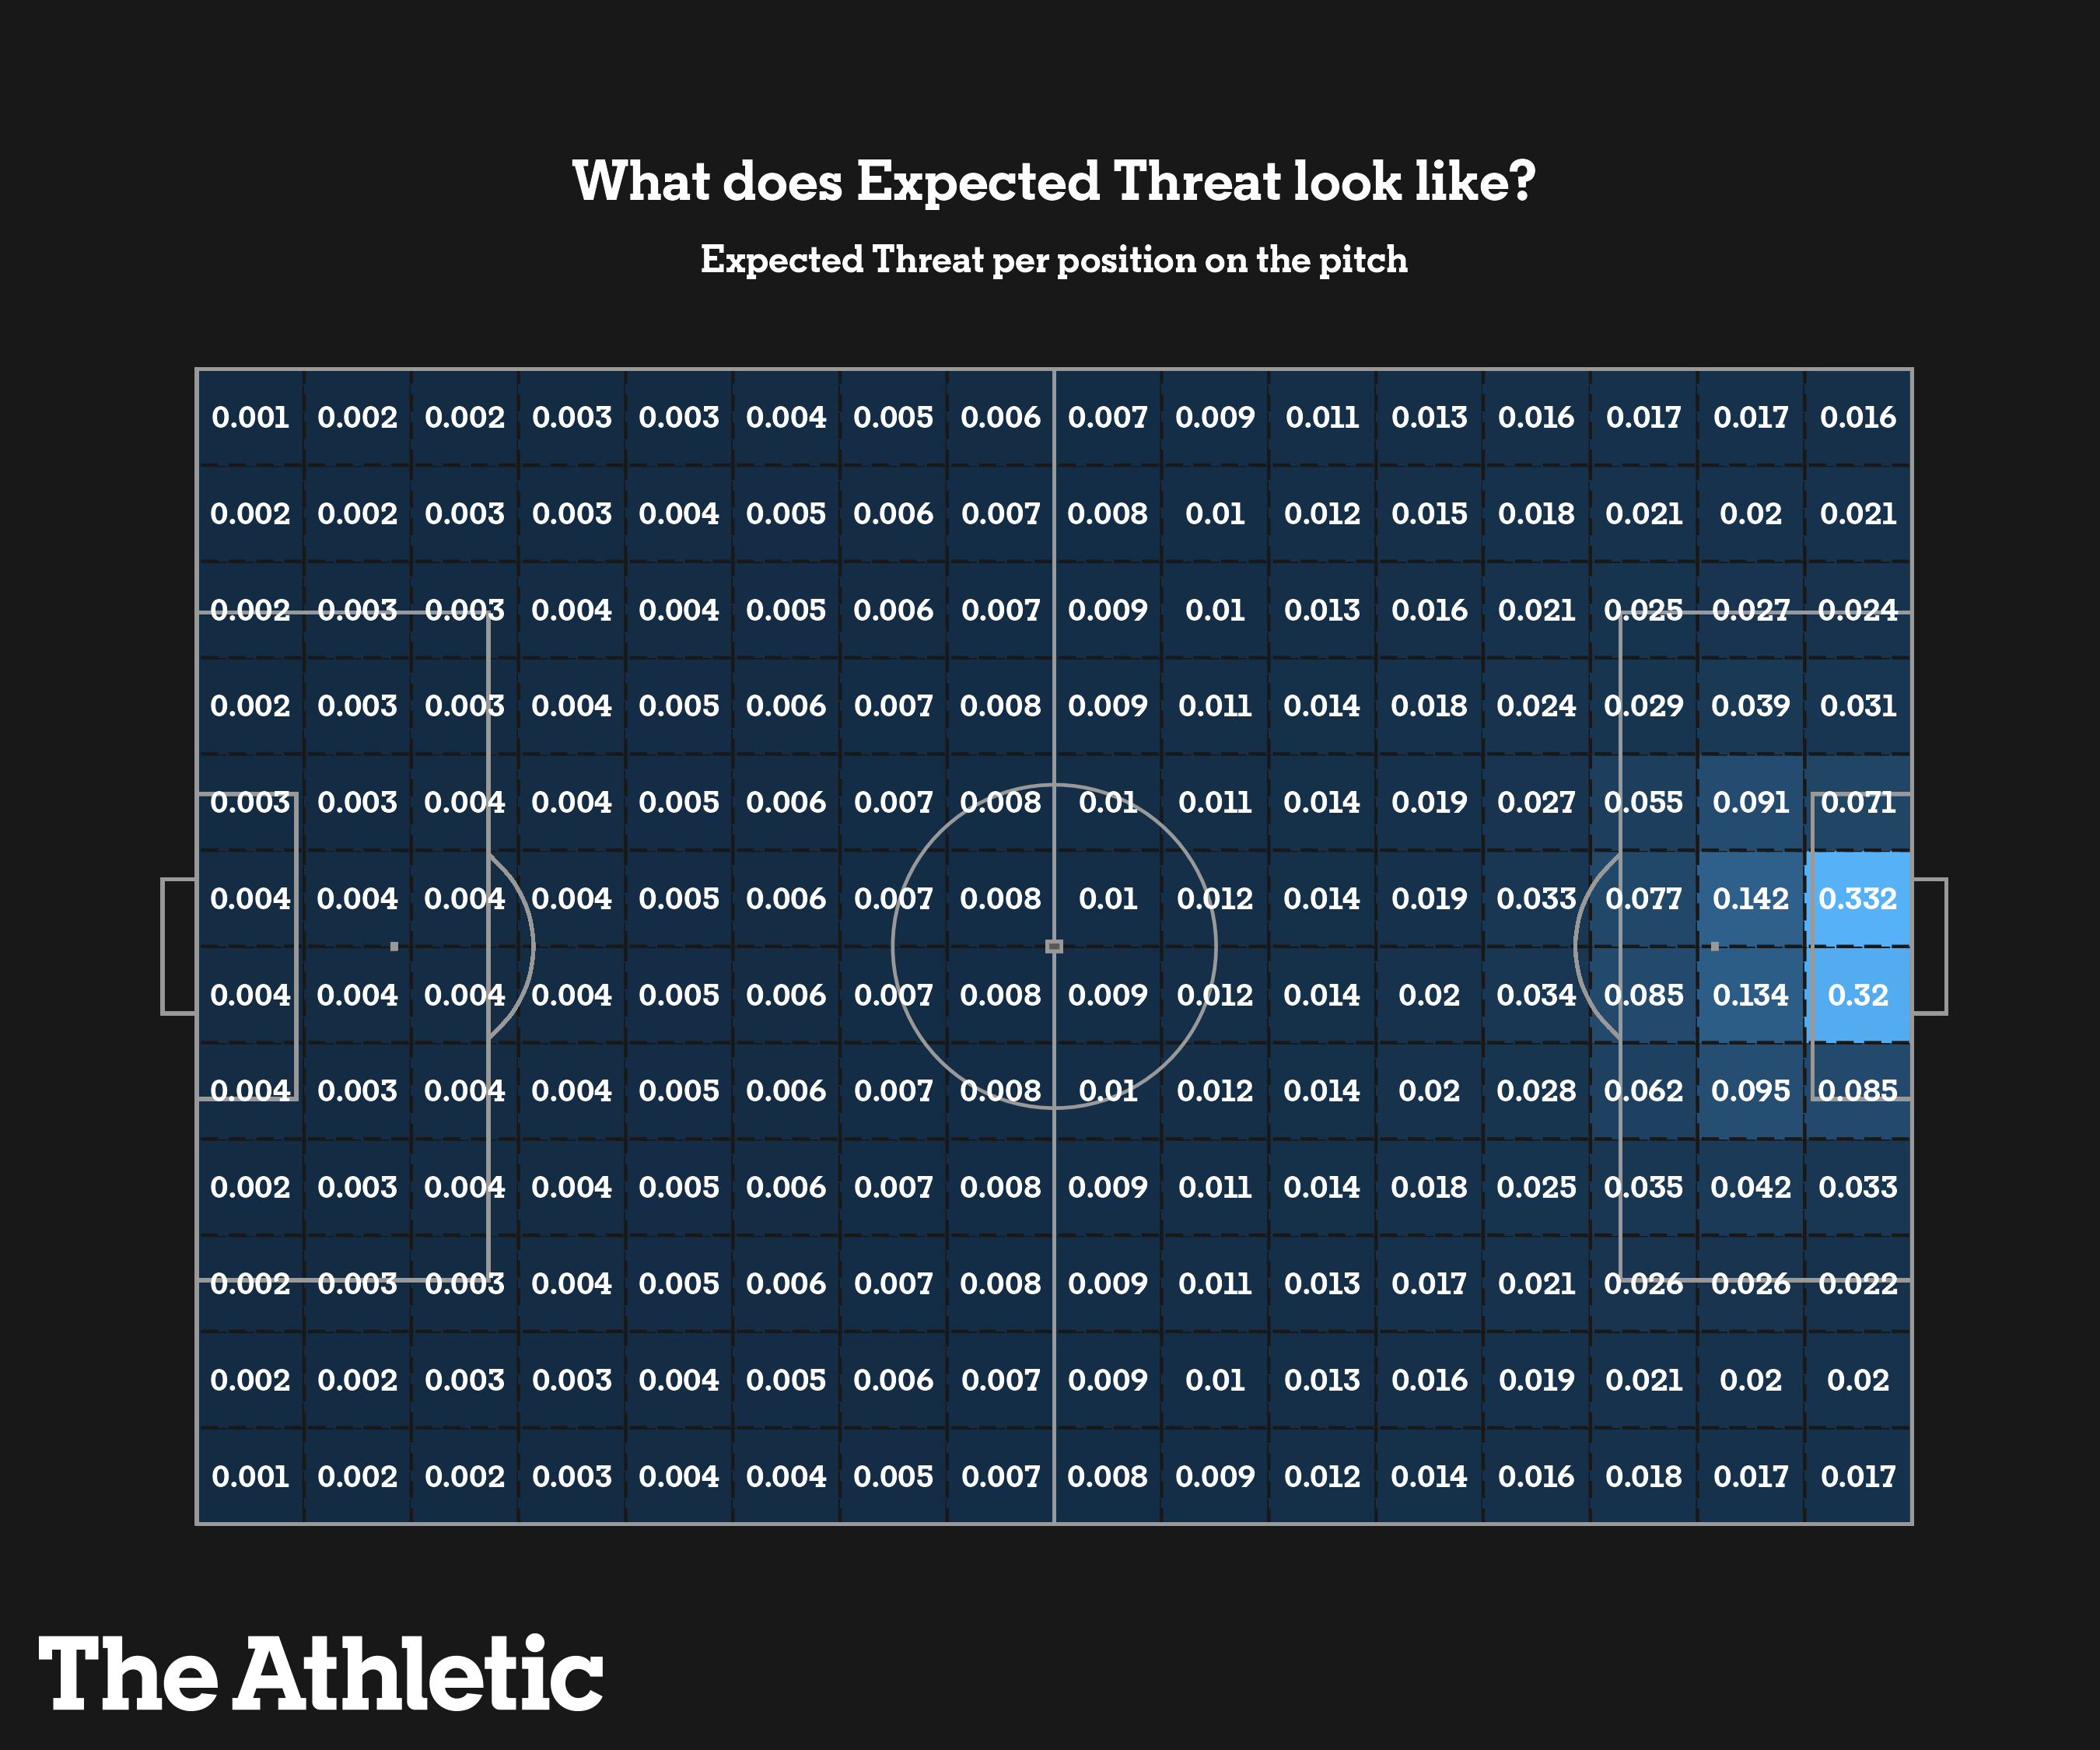
The latest attempt to bring a metric forwards which quantifies something fans already reward is ‘expected threat’. Expected threat, or xT, is a concept that has a long history[1], with the current name coined by Karun Singh in 2018 (you can find his original blog here, and The Athletic’s explainer here). Like all good metrics, the crux is simple – to take a line from The Athletic’s piece: “what’s the chance of scoring in the current possession [passage of play] based on where the ball is now?”.
The article created quite a buzz, leading to a mention on BBC Radio 5Live and an appearance on TalkSport for Worville, getting xT on both major national radio stations for sport in the span of half a week. It is, in a sense, ‘so we’ve got to grips with xG now… what next?’.
There are other ways of creating a metric for this sort of use case though. Between Worville and myself during our conversation for this newsletter, we reference at least four others: VAEP [valuing actions by estimating probabilities, DTAI Sports Analytics Lab], On-Ball Value [StatsBomb], Possession Value [Opta/Stats Perform], Goals Added [American Soccer Analysis]. Why specifically xT then?
Fittingly, given that xT very much sprang from the online analytics community, that community is a large part in it being xT that has made its way to The Athletic. A number of different models from the community were consulted – one provided to Worville previously by Mark (@markrstats on Twitter), a json file of xT values that Singh made available, and the Python package socceraction – to help determine how best to build The Athletic’s own model.
“With [the] socceraction Python package and a good community of people who have been there and done that and can answer questions, it [xT] just felt like the easiest one to build and explain,” Worville told me. He also name-checked a number of people -- Singh, Mark, Abhishek Sharma, and Pieter Robberechts -- in a tweet when The Athletic first unveiled their own version of the metric.
As well as this, xT is probably the simplest and most easily explainable of the possession value family of metrics. You can, as The Athletic have done, divide a pitch into a grid and show people in one image how ‘threatening’ each area of the pitch is.
 |
Asked about whether some on the more pure-analytics side of things might prefer a different approach, Worville sounds open to future changes. “I think it's fine to probably look back in a year and be like, ‘oh, you know, that was a bad approach or that's tame’ but that's just the nature of science I guess, at times,” he says. “I think there's no reason to have nothing until we have a perfect model.”
A factor to consider is also that The Athletic doesn’t have as wide an array of data, or analyst power, to work with as, for example, the data providers creating their own possession value-type metrics. But this also raises the interesting point that this is a very different introduction of a metric to ‘the mainstream’ than its spiritual predecessor expected goals.
When xG first hit mainstream outlets in 2017, it was because Opta had added it to their feeds, which the likes of the BBC and Sky Sports used. Indeed, one of the reasons why Worville felt now was a good time for expected threat was that “I just thought that's a good opportunity to kind of pounce on, if it's only going to be a short window of time before a supplier brings out something new in a feed, [and] if we kind of get in there and talk about stuff first.”
The Who
Matt Cheetham: “For us [Sky Sports], it [the usage of advanced stats] is generally a case of how much producers, presenters and pundits buy into the stats. A producer [is] driving the show, so their input is key. I can’t talk for pundits, but I assume a lot of them understand how often something like xG is used by clubs, so appreciate its relevance in analysis.”
Tom Worville: “My editor understands stats and analytics, much more now than he did when I started. And I think he has that level of trust in me that this [xT] is going to be something that will interest people.”
Mike Goodman: “When you’re doing what I’m doing now which is driving coverage, I have professional responsibilities for traffic or sign-ups or whatever, but it’s [also] sort of like ok what does coverage look like that our audience wants to see, that differentiates us from competitors.”
When I was speaking to Tom Worville for this newsletter, I wondered aloud whether expected threat was following the same trajectory as expected goals. There had been several years when xG had been something that an online community of enthusiasts used, cobbling together models of their own, before it was productised to serve to the masses. Karun Singh’s xT blog was in 2018, and now in 2021 we have The Athletic introducing it, getting mention on national radio as a result.
Worville didn’t wholly agree. “I’d probably say xT is arguably a bit quicker,” he says. “I think the trajectory is slightly different.”
It certainly will be now. The people involved in earlier waves of advanced stats are making their presence felt. Some who pioneered expected goals and got it used in clubs are helping to persuade pundits that it, and other advanced stats, are worth listening to. Some are helping shape the entire football output for major outlets. Some are bringing a new metric to the attention of audiences who otherwise may never have come across them.
“I think we've probably got a good platform now where a lot of the stuff that we do will hopefully seep into broadcast at some point and other outlets will be doing it,” Worville says. “And that's only going to be positive, I guess, as an analytics community trying to get more people interested in using this stuff.”
Worville also points out that, while an increasing number of members from the online analytics community go quiet because they get hired (by clubs, data providers, or consultancies), a lot of people are new to this world, new enough that they might have missed Singh’s original blog in 2018. The community is still going strong, like with the individuals Worville mentioned in his xT tweet (and Omar (@placeholder1966 on Twitter) who he also mentioned during our conversation), and the new waves of people who might be being introduced to advanced stats with xT.
The What (reprise)
Each of the three people I spoke to for this newsletter would probably be displeased if I left you all with the impression that using advanced stats is all about using the latest xMetric. Heck, you don’t even have to mention them out loud at all.
“I think at some point what happens is you want to be knowledgeable of them [advanced stats] and to run in the background of what you’re saying,” Goodman says. “I’ll talk to people who call games for a living and they’ll say this, even with expected goals, they’ll say ‘I don’t want to mention expected goals on the air but I do want to be able to say with confidence that that shot that that guy just took relatively rarely turns into a goal’.
“I think if it’s informing your analysis and it’s used correctly to inform your analysis I don’t really care if you’re explicitly saying the number or explicitly writing the number.”
But where advanced stats are explicitly mentioned, Goodman is also clear that they shouldn’t be just about an xNumber, as coverage can sometimes (I say as someone guilty of this myself) become: “My desire for expected goals would be for it to be less of the sort of sun that everything else revolves around and more of a tool in an arsenal,” he says. Expected threat may help that, of course, as Worville suggests: “xG is good but I guess it gets to a problem where you wanna learn a bit more, and it goes beyond xG, it goes beyond progressive carries and passes, which I think is something that we use a lot [at The Athletic].”
“Let's get away from xG a little bit and just kind of compare [sides like Brighton, who underperformed against expected goals last season] to how other teams can build up and how other teams build and stage attacks,” he goes on to say, about xT.
But expected threat certainly isn’t going to be the last new metric that will enter mainstream coverage. “A lot of the more advanced metrics feel on the fringes of regular coverage at the moment,” Cheetham says. “The more they underline a theme, or feature in pre/post-match analysis, I think the more often they’ll appear.”
Footnote
[1] The example that probably hits the middle of the Venn diagram of ‘earliest’ and ‘most significant’ may be then-StatDNA Sarah Rudd’s 2011 presentation at the New England Symposium on Statistics in Sports (NESSIS) [slides available here]. ‘Non-shot expected goals’, which had a peak in interest around, at a guess, 2016 is also something I’d consider a familial relative of xT.