Everything you need to know about defensive statistics (well, the basics)
Stats have taken off, TV coverage is using expected goals, but what about defenders? As we'll see, defensive statistics are a little more nuanced, a little more sophisticated, but this article will cover all you need to know about the basics.
Contents
So, what stats are good for judging defenders?
Let's start with a metaphor. Imagine you're a first-time parent and you keep track of everything you and your partner do to make sure you're even better parents for any future kids. After 18 months you look and there's one category your stats are way higher than your partner's for: catching the baby when they fall off things.
Does that make you a better parent or a worse parent?
Better: you catch more? Worse: the baby falls more? What's the point of the 'catch the baby' parenting analogy?
It's like a lot of defensive stats: is a higher number better? It's better than conceding goals, for sure, but is it high because something else is wrong somewhere?
And with statistics like goals and shots conceded, a single defender rarely has have full responsibility, or even most of the responsibility.
US sports are able to get around this a little with the amount of substitutes and rotation between games, but with such short seasons, few subs, and relatively stable line-ups, football doesn't work in a way that makes 'better/worse than replacement' stats easy either.
Can you tell which defenders are doing the roles they've been given by the manager better than others?
Kind of, but you need to know what roles they've been given to do that. Analysts in clubs will simply know that, of course, but on the outside we have to work it out from watching games or estimate it from looking at the stats in a slightly different way.
What kind of defensive stats are about roles and what are about performance?
Generally, the number of defensive actions and where on the pitch the player makes them are indicators of role. That doesn't mean that they're not linked to how well the player's fulfilling that role, just that big differences are likely to be about role rather than quality.
Things like tackle win rate or aerial duel win rate are more performance-based - but those can be affected by role too.
How is duel win rate affected by the role of the player? Surely it's just about how many they win?
Some defensive players will be encouraged to go for higher-risk tackles. As an example, a player who is asked to mop up behind a high press might be asked to attempt high-risk, high-reward duels.
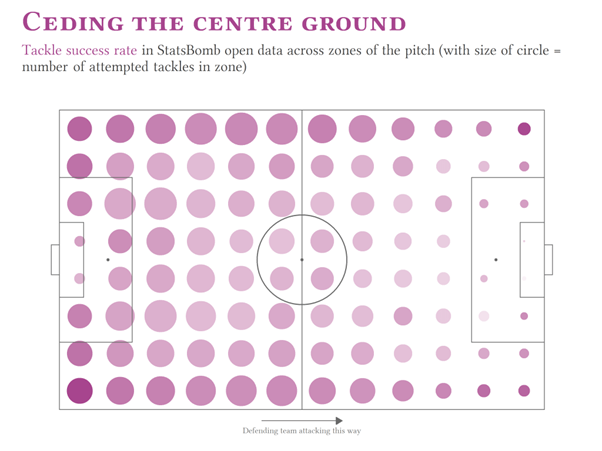
More generally, previous work by Get Goalside has pointed out that tackle success rate seems to be lower in the middle of the pitch than near the sidelines. (Lighter colour on the visualisation below = lower success rate; smaller circle = fewer attempts in that location).
What defensive stats should I look at then?
Generally, high numbers of things like duels, tackles, interceptions will indicate who's an 'all-action' type of player and who isn't. If you want to look at tackle/duel success rates, it's best to compare players to others who play in the same position and attempt a similar number.
(e.g. compare a central midfielder who attempts 5 tackles a game to other central midfielders who attempt around 5 tackles per game, not to central midfielders who attempt 2 tackles per game - they're probably playing different roles)
Clearances usually tell you whether a player's team is under pressure a lot - the highest number of them happen inside the box in games where the opposition is swinging crosses in. Meanwhile recoveries are usually partly affected by the team's approach to possession - this is because some definitions of a 'recovery' require the team to have kept the ball for a certain length of time after the defender recovers it. A team who always try and play on the floor will be more likely to meet that threshold than a team who tend to launch it long.
Those are some general rules of thumb, but the way that data companies collect defensive stats varies a lot more than the way they collect passing or shooting stats.
Lol. Why do data companies collect things differently?
Apart from cross-shots, shots are easy to define without being controversial. Passes usually are too. But players 'duelling' or 'attempting to tackle' or simply standing in the way and getting lucky is often a bit more fuzzy and random. Shots and passes is usually higher up the list of priorities for attention too.
There also seems to be more cultural differences. In England, 'tackle' means a standing tackle or a sliding tackle; in parts of Continental Europe, what gets translated as 'tackling' usually means slide tackling only. Certain countries are more keen on using the term 'duel' than 'tackle'.
And then, a lot of defensive work happens where the ball isn't. It's not just tackles, but filling space to prevent passes and tracking runs. When data is collected by people watching video of televised games, this type of thing is harder to (cost-effectively) take notice of.