Time on the clock
There isn't enough public analytics done with the humble fan in mind.
Previously in Get Goalside, I argued that the focus with 'ball-in-play' time over the last few years is somewhere between benignly silly and a player welfare concern. Some coverage of 'BiP' has tried to spin it as a value-for-money issue (despite the fact that in-play time looks pretty similar to historical levels), but it's far from clear that 'match is live for longer' means 'match is good'.
In fact - with the memory of several cold, dull in-stadium experiences in mind - I might go so far to say that teams whose tactics end up with more in-play time actually make for worse matches.
[Ball-in-play Part One here and ball-in-play Part Two here]
One should check one's biases though.
The same data that was used for those previous posts can be used for just this question. There are various ways that you could measure 'excitement' in a match, as a starting point let's just look at the time spent in the final third. It's not a good proxy, but it's passable.
In the graph below, the platonic ideal is to be in the top-right.
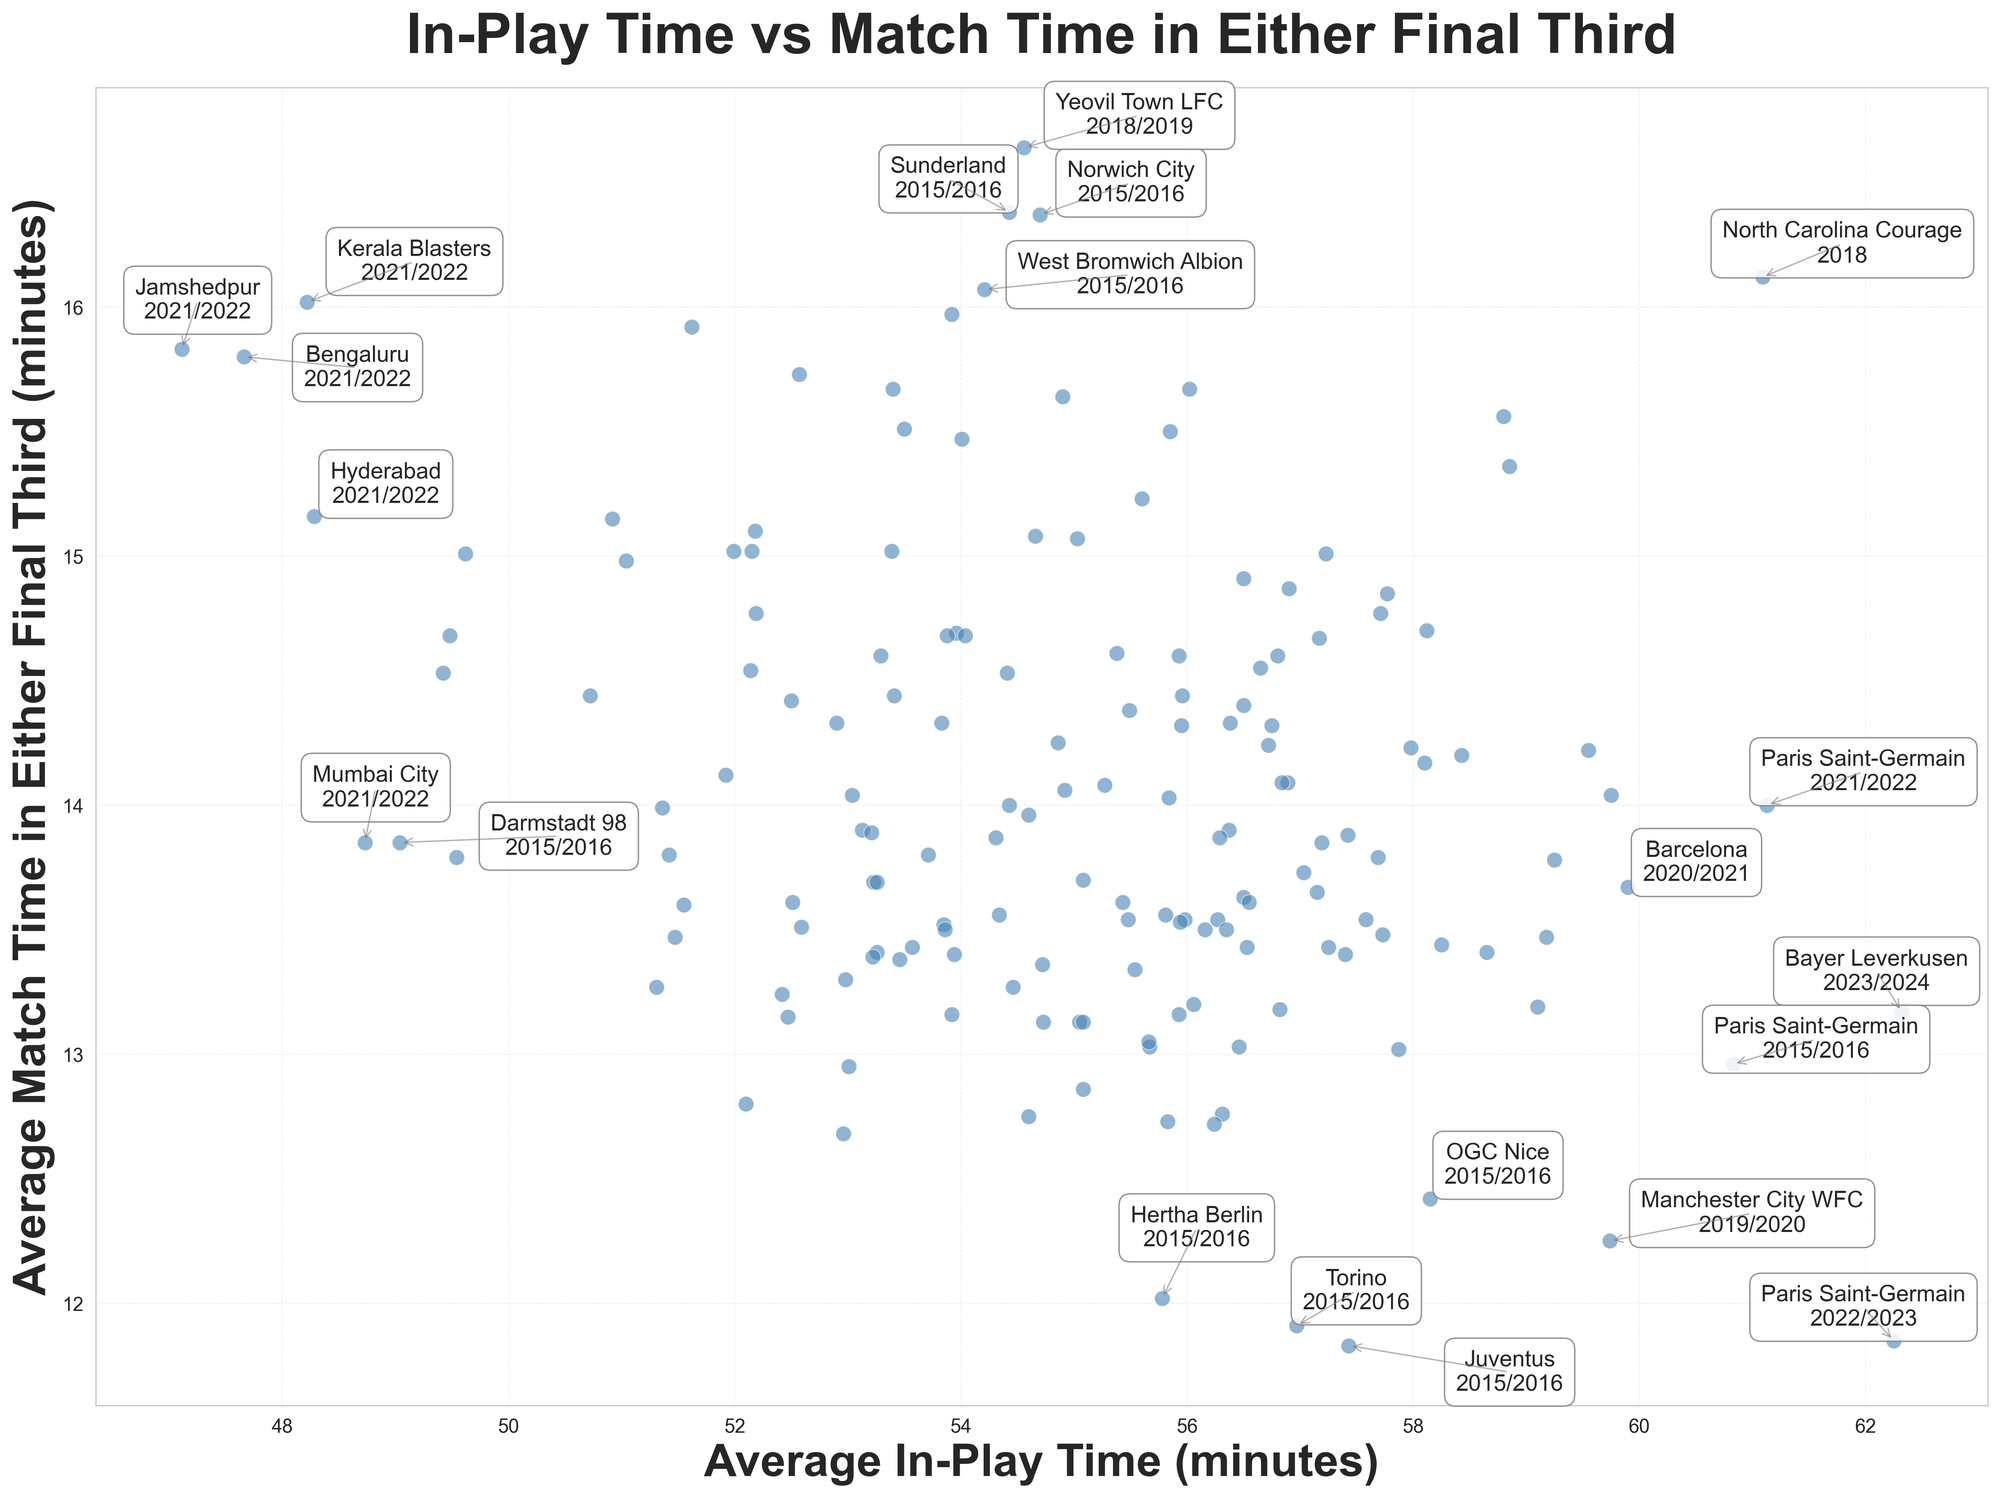
This is every team in the Statsbomb publicly-available dataset who've played 15 games or more, which is why you're seeing Indian Super League and NWSL teams.
The bulk of this chart actually seems like much of a muchness, a fairly round clump with a few groups of outliers. In the bottom-right are the possession-focused bores; the top-left are top-half ISL teams from that season; and middle-top are a group of teams we'll touch in in a moment.
(Several of the labelled teams are partial: any labelled team-season that Lionel Messi was in only represents matches he played in; some NWSL and WSL teams are slightly-partial seasons due to video availability iirc)
One could argue that this is a minor confirmation of my theory: money doesn't buy you happiness and ball-in-play time doesn't buy you action. I think I'd want a broader dataset before I pat my assumptions on the back, though.
And maybe, in fairness, we should not blame teams like 2022/23 Paris Saint-Germain for being so dull.
The previous plot showed the time that either team spent in the attacking third in matches featuring those sides. So for that partial 22/23 PSG season, their games averaged about 12 minutes of PSG or their opponent in the attacking third. Indeed, it takes two to tango, and if we just split out the time that individual teams spent in the final third - as we do below - we see that PSG 22/23 actually spent a 'normal' amount of time in the final third.
Red line dotted indicates half of the match-average final third time being for the named team; above the line = more dominant teams, below the line = less dominant teams.
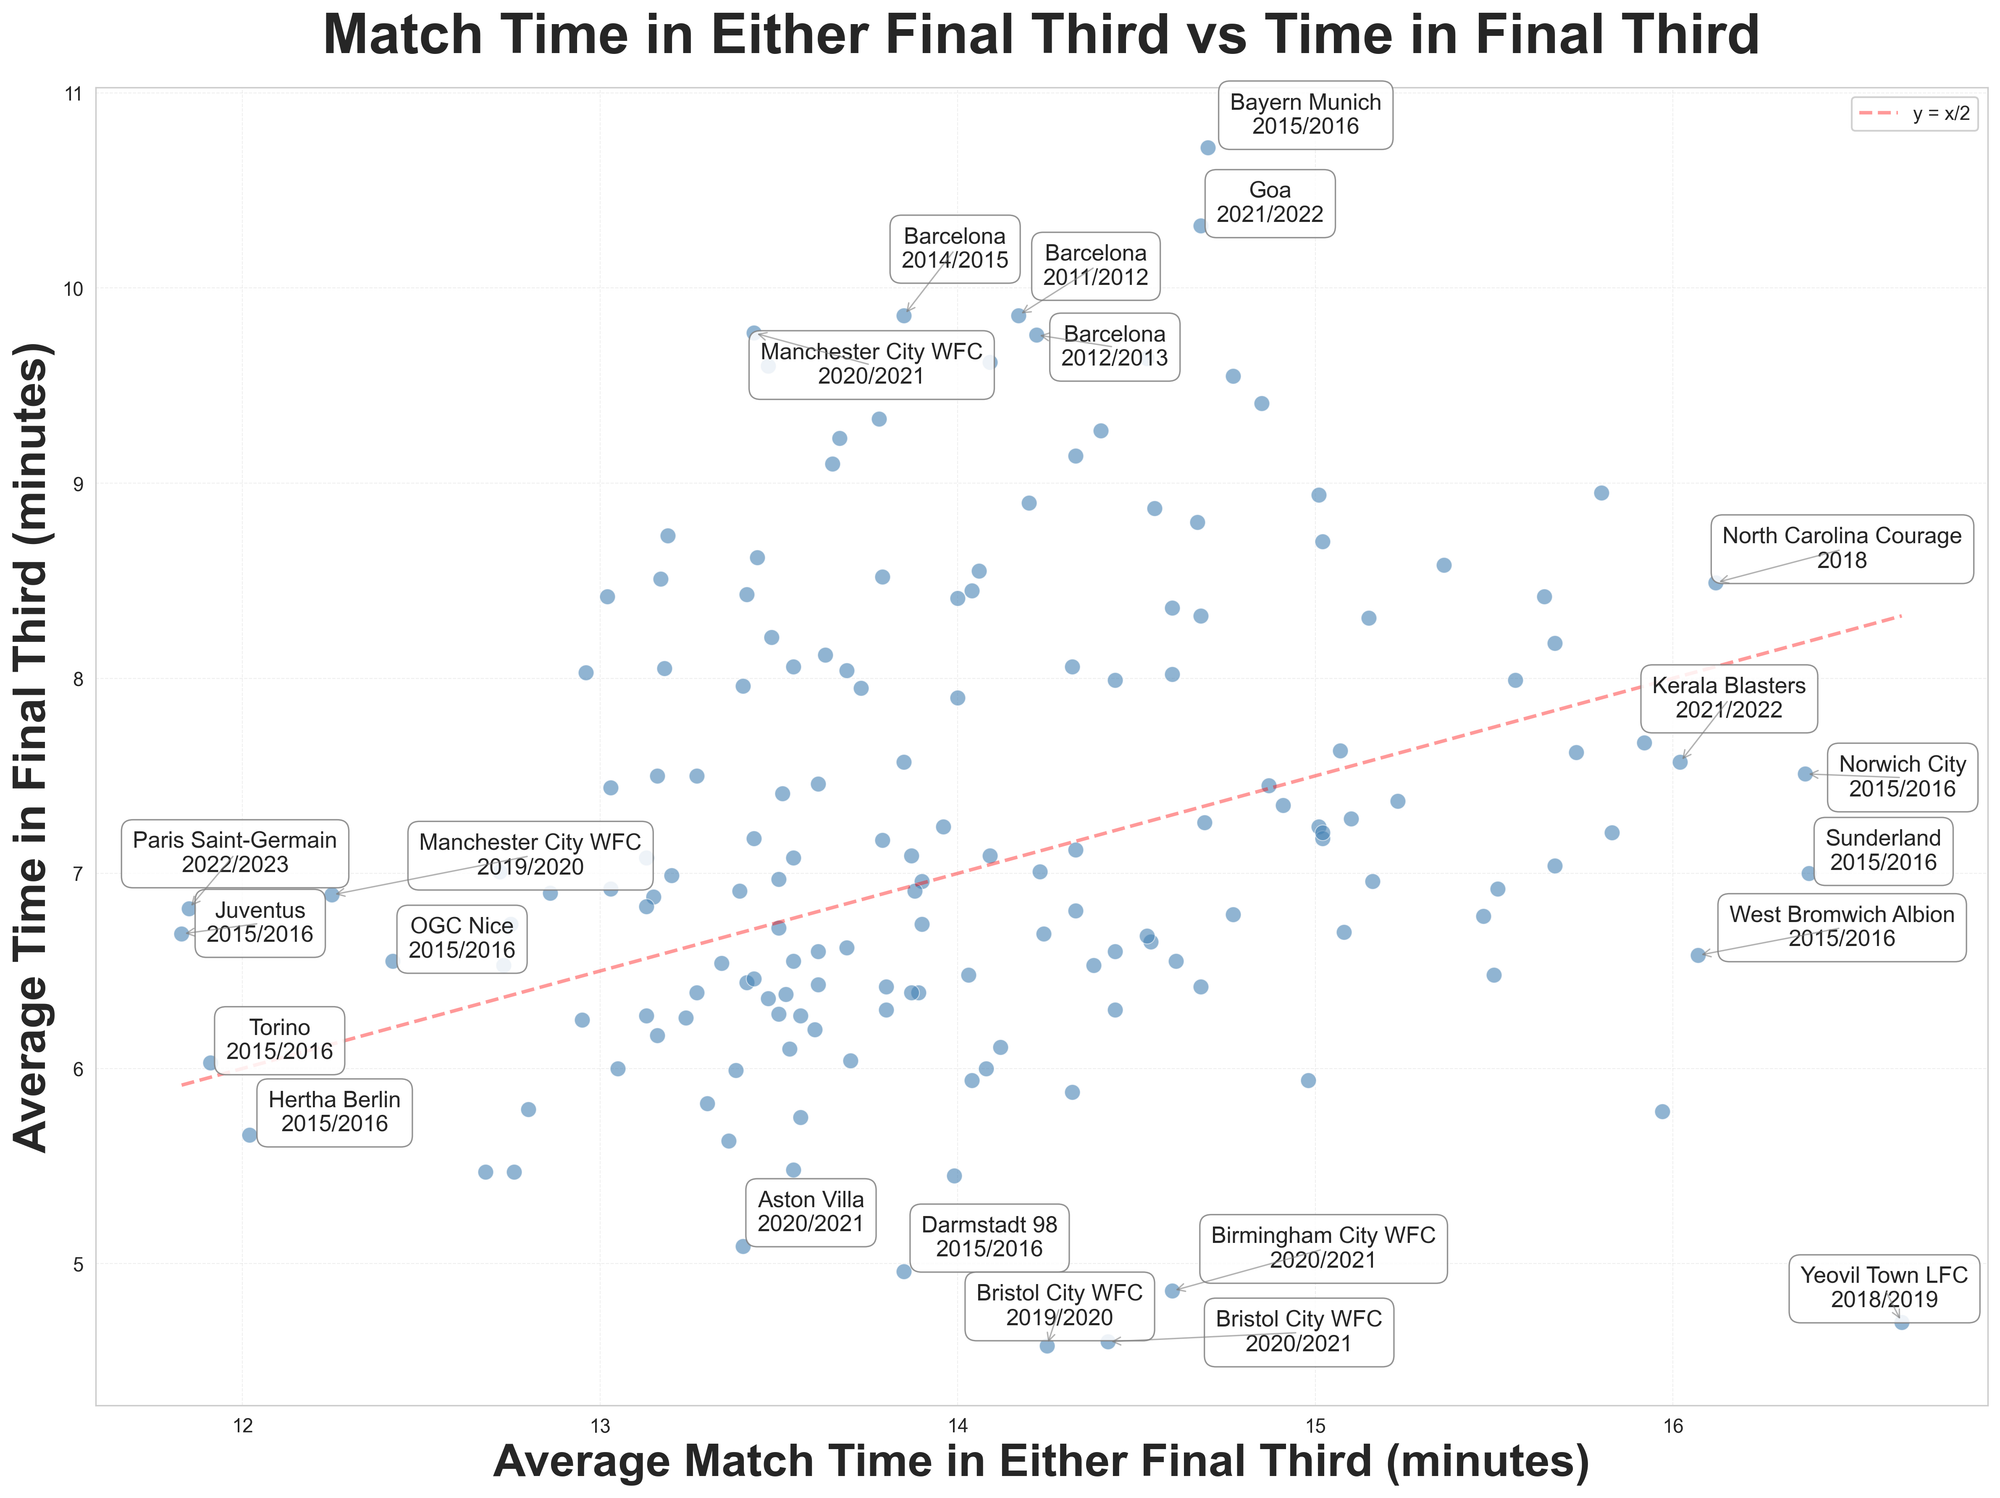
That clump from middle-top of the first image that I said we'd touch on later? Yeah - generally speaking, matches with those teams saw a lot of final third action because of their opponents. (Poor Yeovil Town in their WSL season, making their opponents look like Bayern Munich).
The middle-top of this second chart is a totally different type of team: the throttlers, the dominant* possession-heavy teams who simply did not let the ball into their own defensive area.
*And Goa, who finished 9th that season. You'll be unsurprised to learn that all five of their foreign player slots were taken by Spanish players. A quick scan of FBRef tells me that their opponents had the highest on-target rate of their shots, and the highest on-target shot conversion in league too. That's a story worth blogging about.
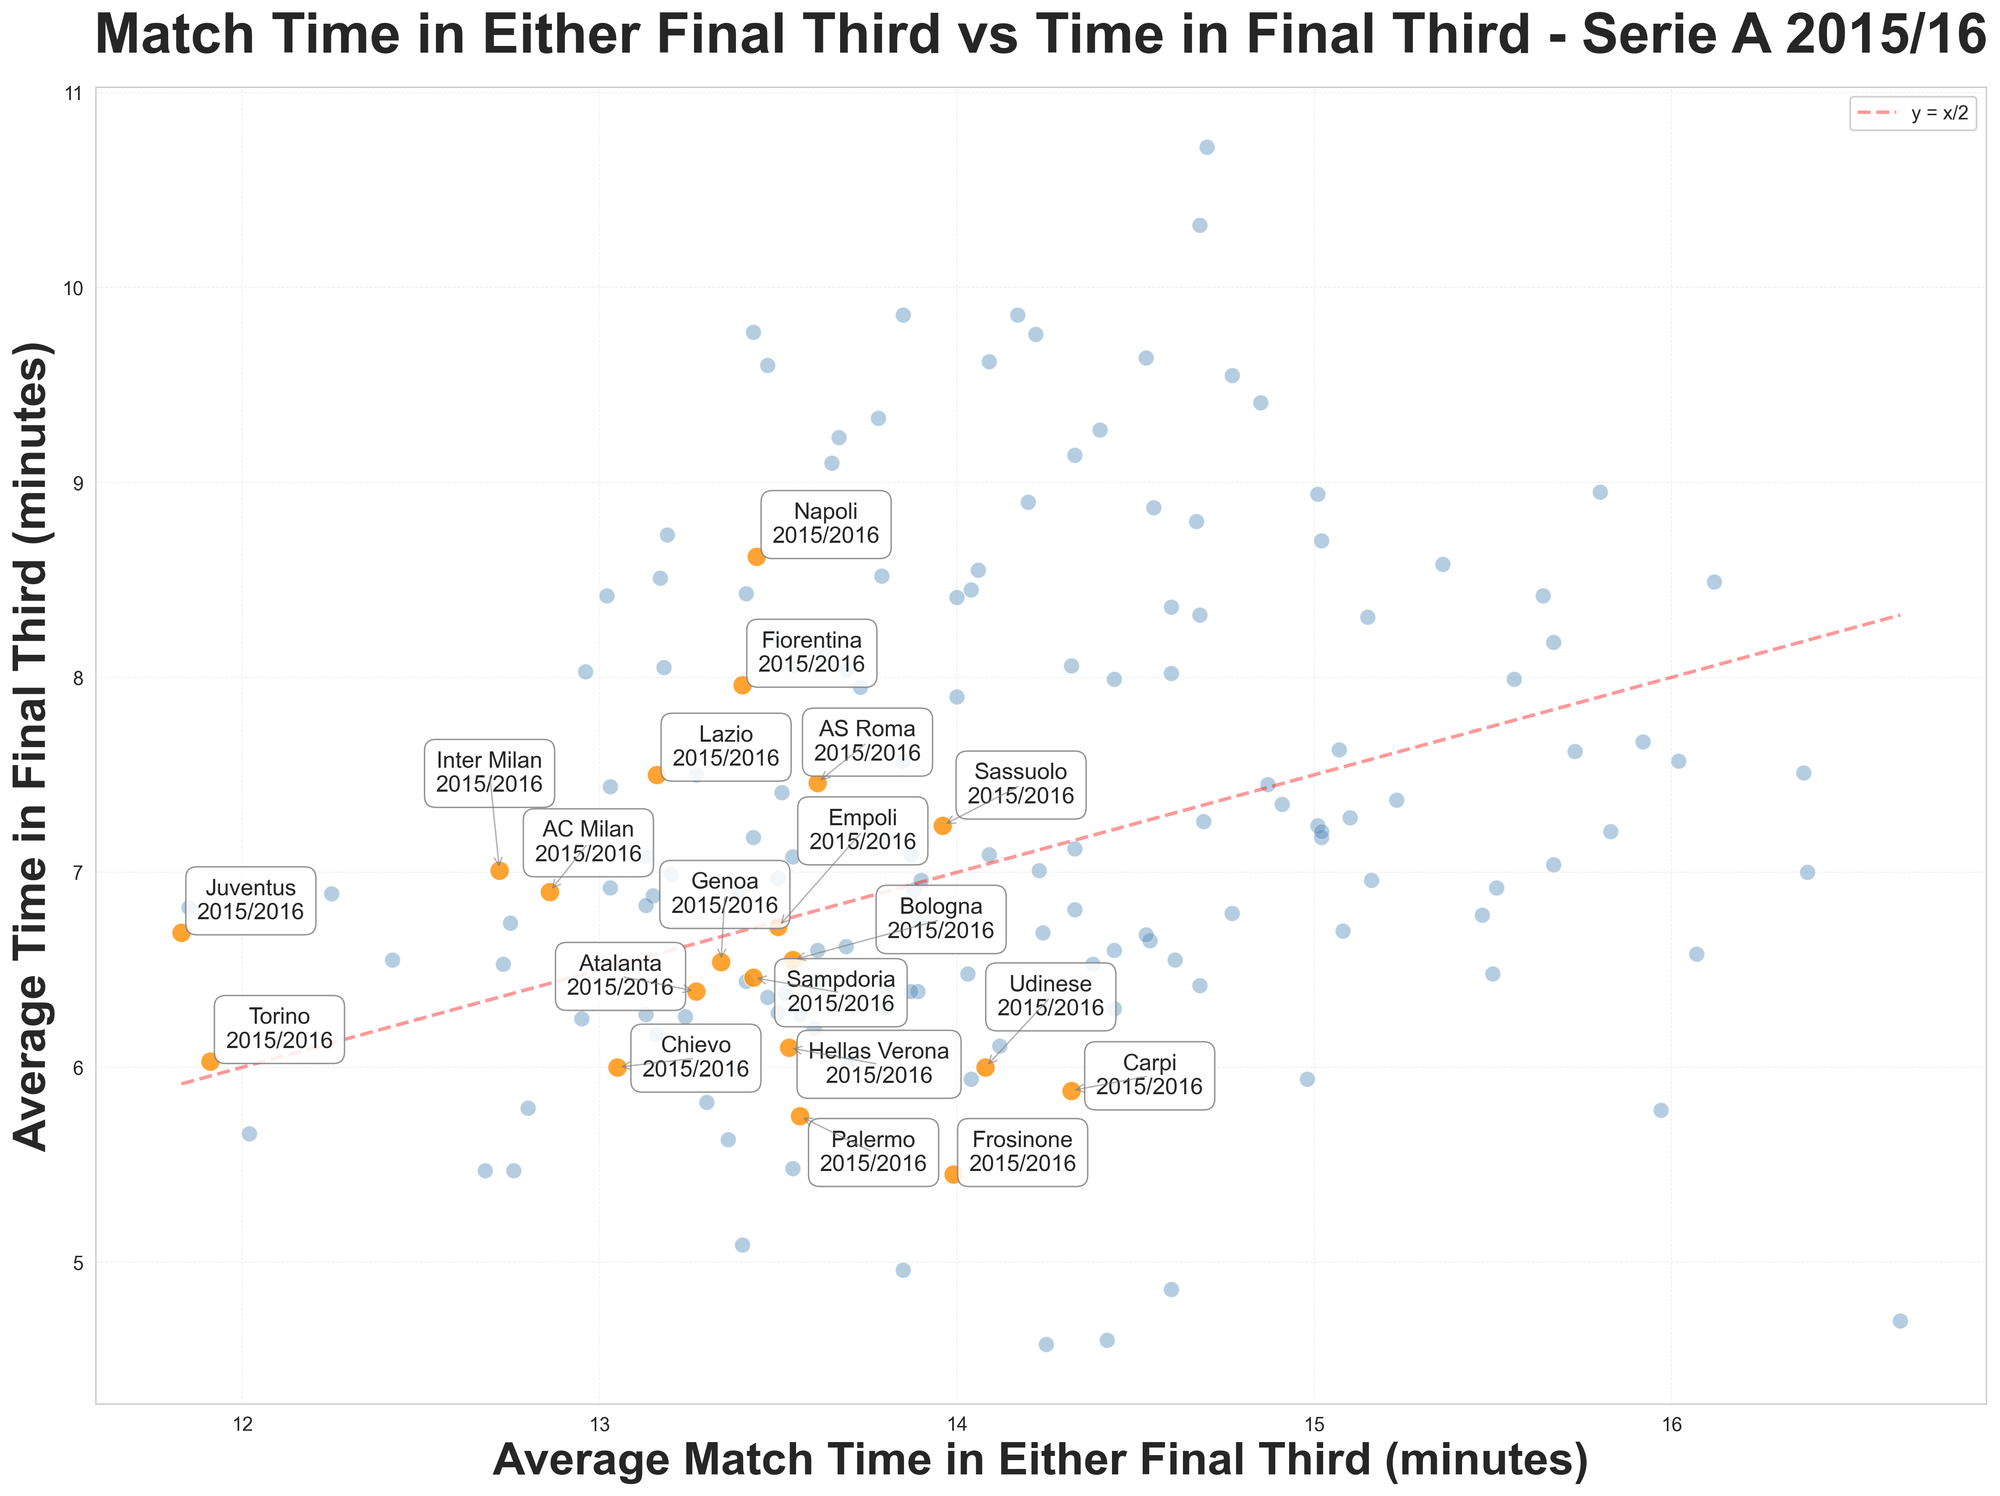
Unsurprisingly, Serie A teams make up the bulk of that 'bottom left quadrant' clump.
--
You could tinker with the definition of 'exciting time', most obviously to include time spent further back in the field during quick attacks, or time when a defence is in possession close to their goal under intense pressure. You could also throw shot stats into the mix here, look at xG created.
If you have the data [cough, Opta Analyst], you could spin this data up for current teams, and see what direction trends are going in. The logic is fairly simple: actions into the final third start the clock; turnovers, restarts, passes back outside the final third, or non-turnover actions by the non-possession team that clear the final third (e.g. blocked passes, clearances) all stop the clock.
If anyone needs some football-watching to pass the time, I guess you should go find 2018 NC Courage game film.