Finding Messi-esque dribblers and making choices while clustering
Lionel Messi is to dribbling a football what Vincent van Gogh is to layering colour with oil paints: not simply a conventional expert, but with caresses of genius that mark the work as something different. Messi's ball-carrying and close control isn't simply effective, it's beauty -- the fact that it's both is what makes him so unique.
But just how unique is that?
Knowing full well that it wouldn't be a perfect system, I wanted have a go at answering the question, to see if I could find the players that carried the ball the most-similarly to the Barcelona maestro.
One imperfection is insurmountable: the type of breadth of data. I'd be using StatsBomb's free dataset, so I'd only be seeing ball-carrying for or against Barça in matches Messi featured in. The data also only notes events, so the grace of players will mostly be missed.
Still, the dataset gives a lot to work with, and this is where the second problem arises: how do you choose what to use?
Although data and algorithms have the air of nicely in-human objectivity, that's not quite true. The first computers got their names because they just computed maths calculations that humans were already doing by hand. They were calculators more than anything.
Using algorithms isn't too distant from that conceptually. The 'k-means clustering' technique that I'd be using takes a look at the data and sorts it into a given number of groups. You could, I'm sure, take the equations that underpin that and (with a big blackboard) do it by hand, but you'd be going for a very long time.
The human element is the inputs. I knew some things that I didn't want this clustering analysis to result in as I started.
- I didn't want it to turn into 'who dribbles in the same areas as Messi' -- I wanted to leave open the option that someone might be particularly Messi-like while spending their time close to the centre-circle
- I didn't want it to have too many different clusters -- I wanted the results to be fairly easy to digest
In the formulation that I ended up with -- which I'll detail in a moment -- it turned out that the most similar to Messi was Ronaldinho, which was a comforting result.
After a lot of deliberation, I ended up using three variables to cluster on:
- The number of take-ons in a sequence of ball-carrying[1]
- The 'directness' of a carry (the progress towards goal as a percentage of the carry's length, so if you moved 5 yards towards goal in a carry of 10 yards, that'd be a directness value of 0.5)
- Whether the carry was 'long' or 'short', decided somewhat arbitrarily as a carry over 20 yards or not[2]
The reasons why I chose these related to both Messi and the data in general. When I think of the Argentine's dribbling, I think of him getting past players in tight spaces, and generally being pretty effective (direct). The long/short binary was much more of a trial and error though.
It seemed clear to me that any analysis of ball-carrying had to include some sort of indication of distance carried. It might not be a major thing I associate with Messi, but it is clearly a significant differentiator between different dribbles.
The problem I found with this is that it became too big an influence on the clustering, relative to how important I wanted it to be, pretty much swamping anything else. That might be a more accurate reflection of the distribution within the data, but it didn't feel like an accurate reflection of the problem I was trying to find answers for.
So: number of take-ons (which more or less coalesced into 'presence of take-ons or not'); directness; long/short.[3] I chose seven clusters, ran the clustering with kmeans in R, and then applied those clusters to every carry sequence in the StatsBomb Barcelona dataset.
From there, it's easy to find what clusters make up what percentage of each player's ball-carrying, and therefore to find a hypothetical 'average' player. This average player isn't important for anything other than comparing others to. For example, here's a graphic for Messi's ball-carrying clusters ordered by how they differ from the average.
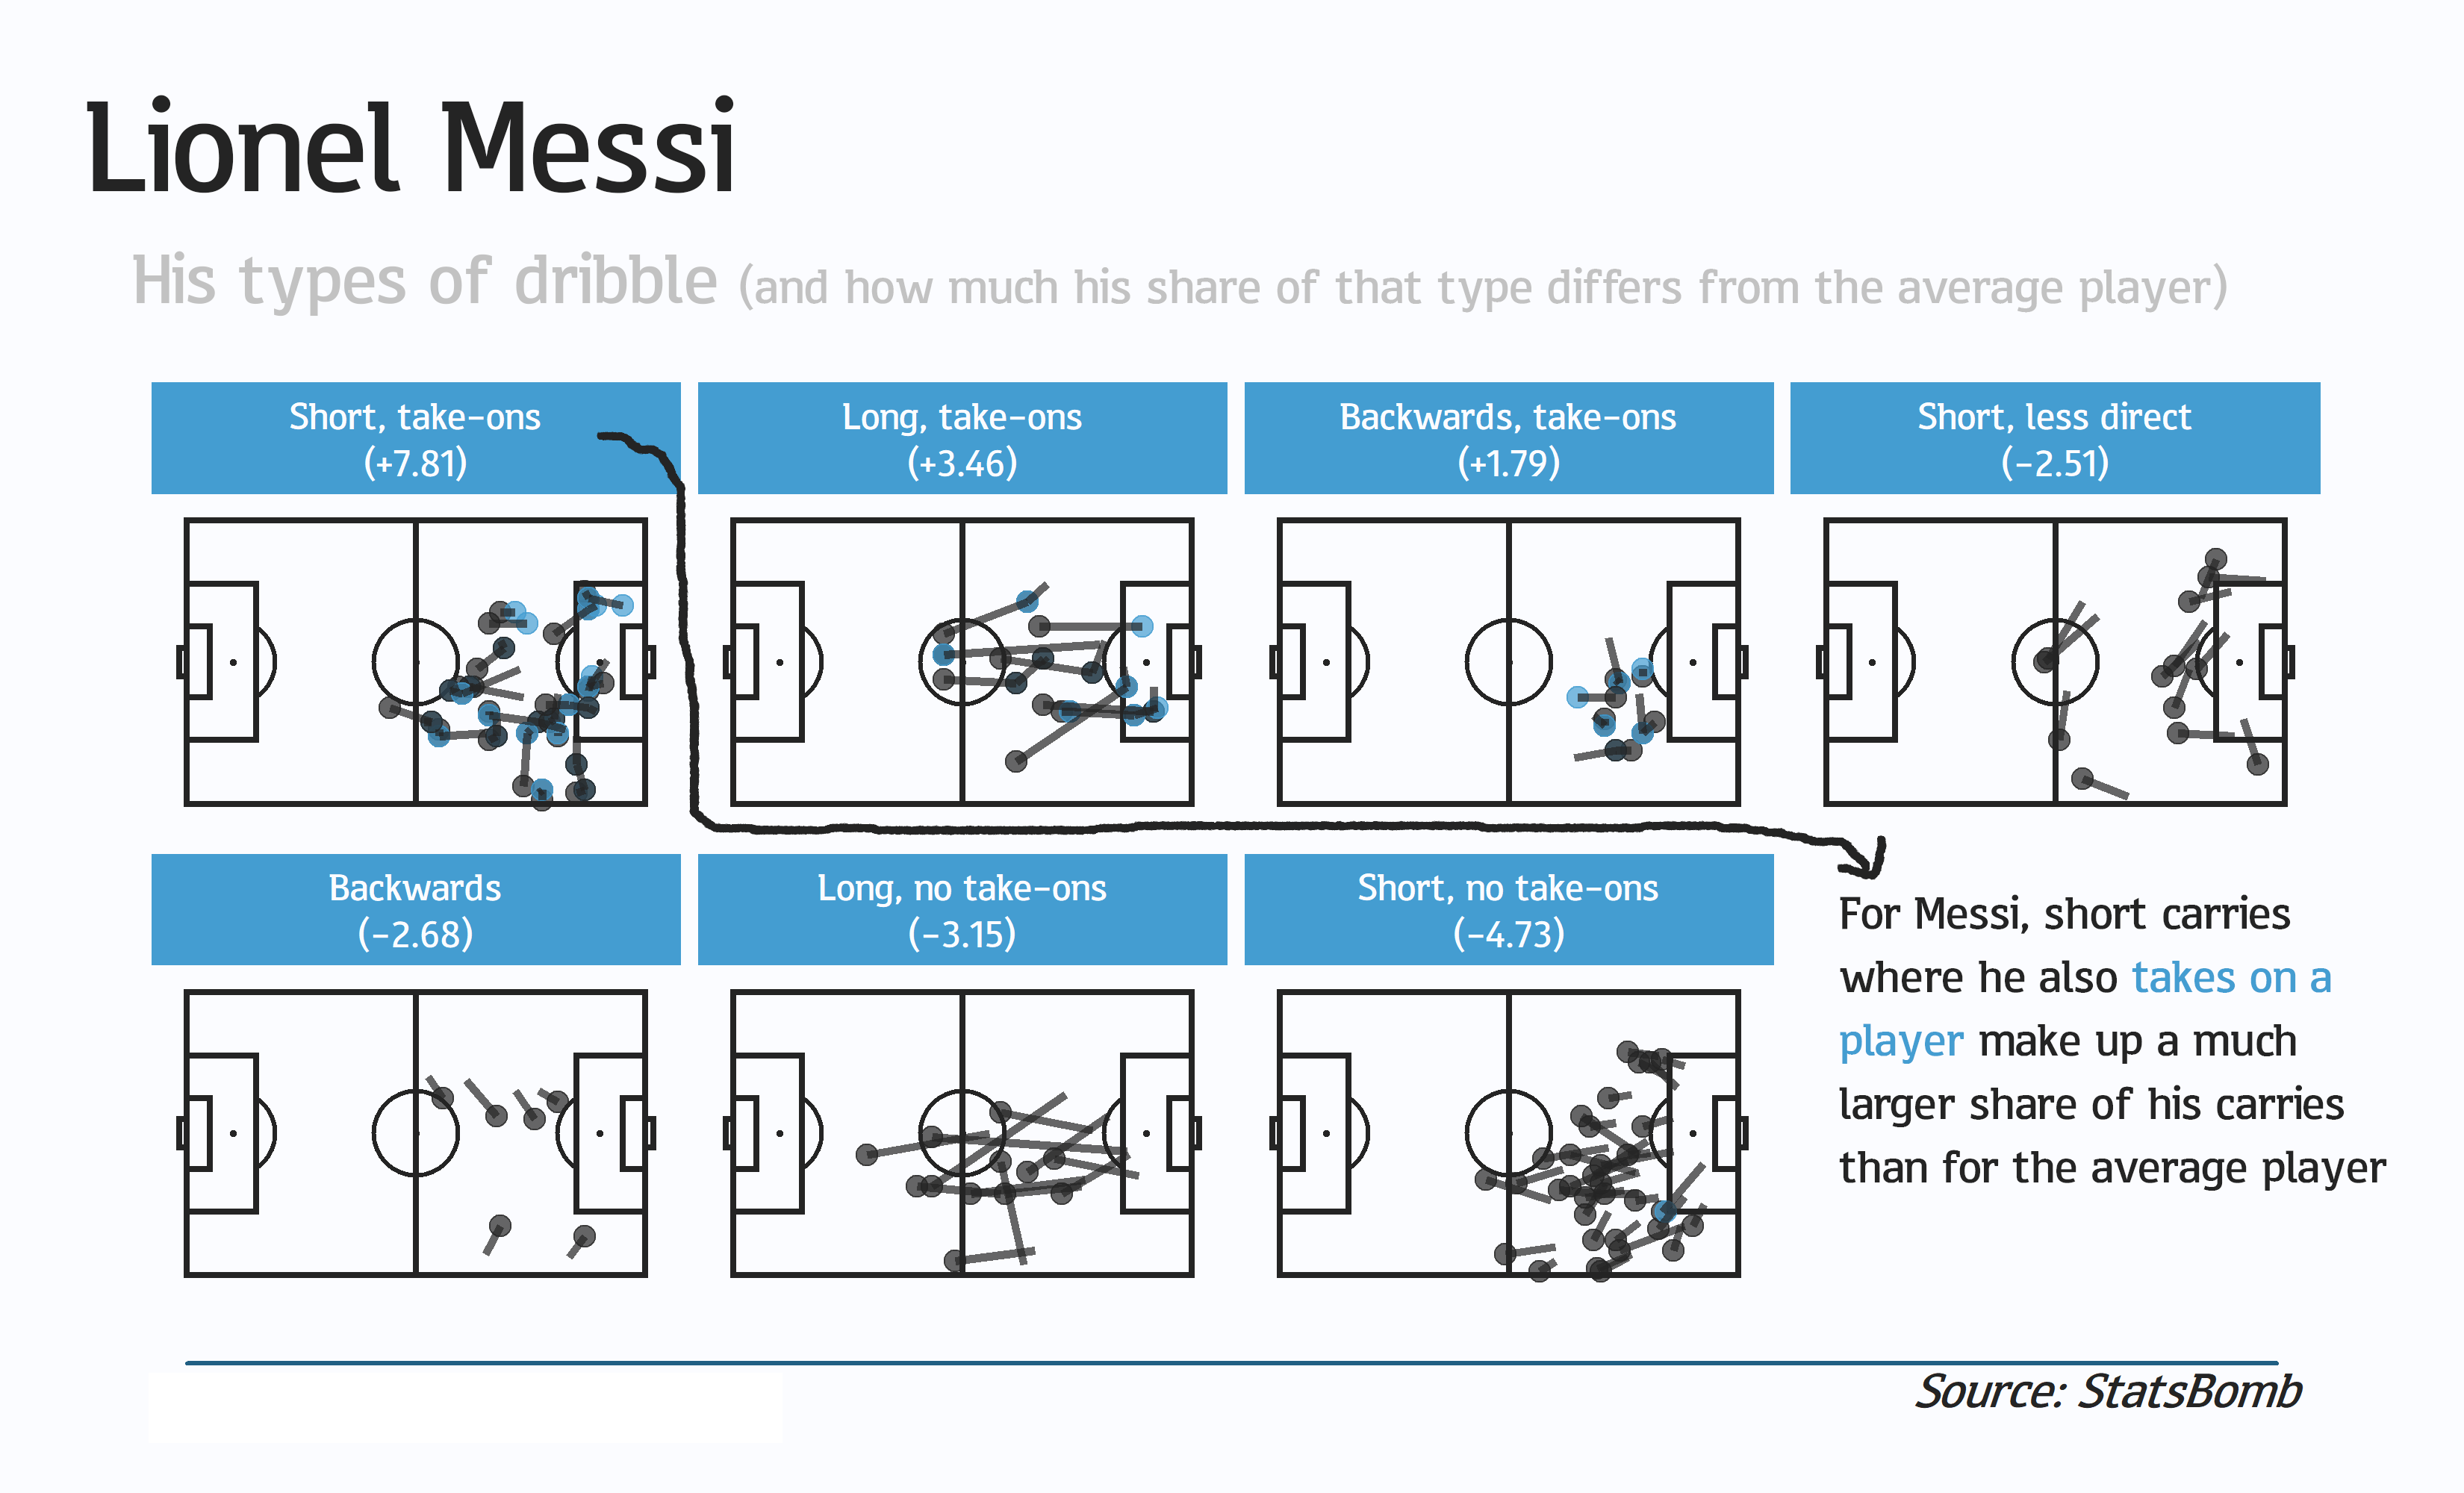 |
The visualisation above shows a pitch for each cluster type of dribbles, with some examples of Messi in each -- dots represent the start of the carry and blue dots represent take-ons. There are 100 dribbles on the graphic as a whole, with the number split between the seven clusters according to how much of a percentage of Messi's dribbles those clusters represent. (For example, the 'backwards, take-ons' cluster has a small number of dribbles shown because it makes up a small percentage of Messi's dribbles, but that percentage share is larger than it is for the average player).
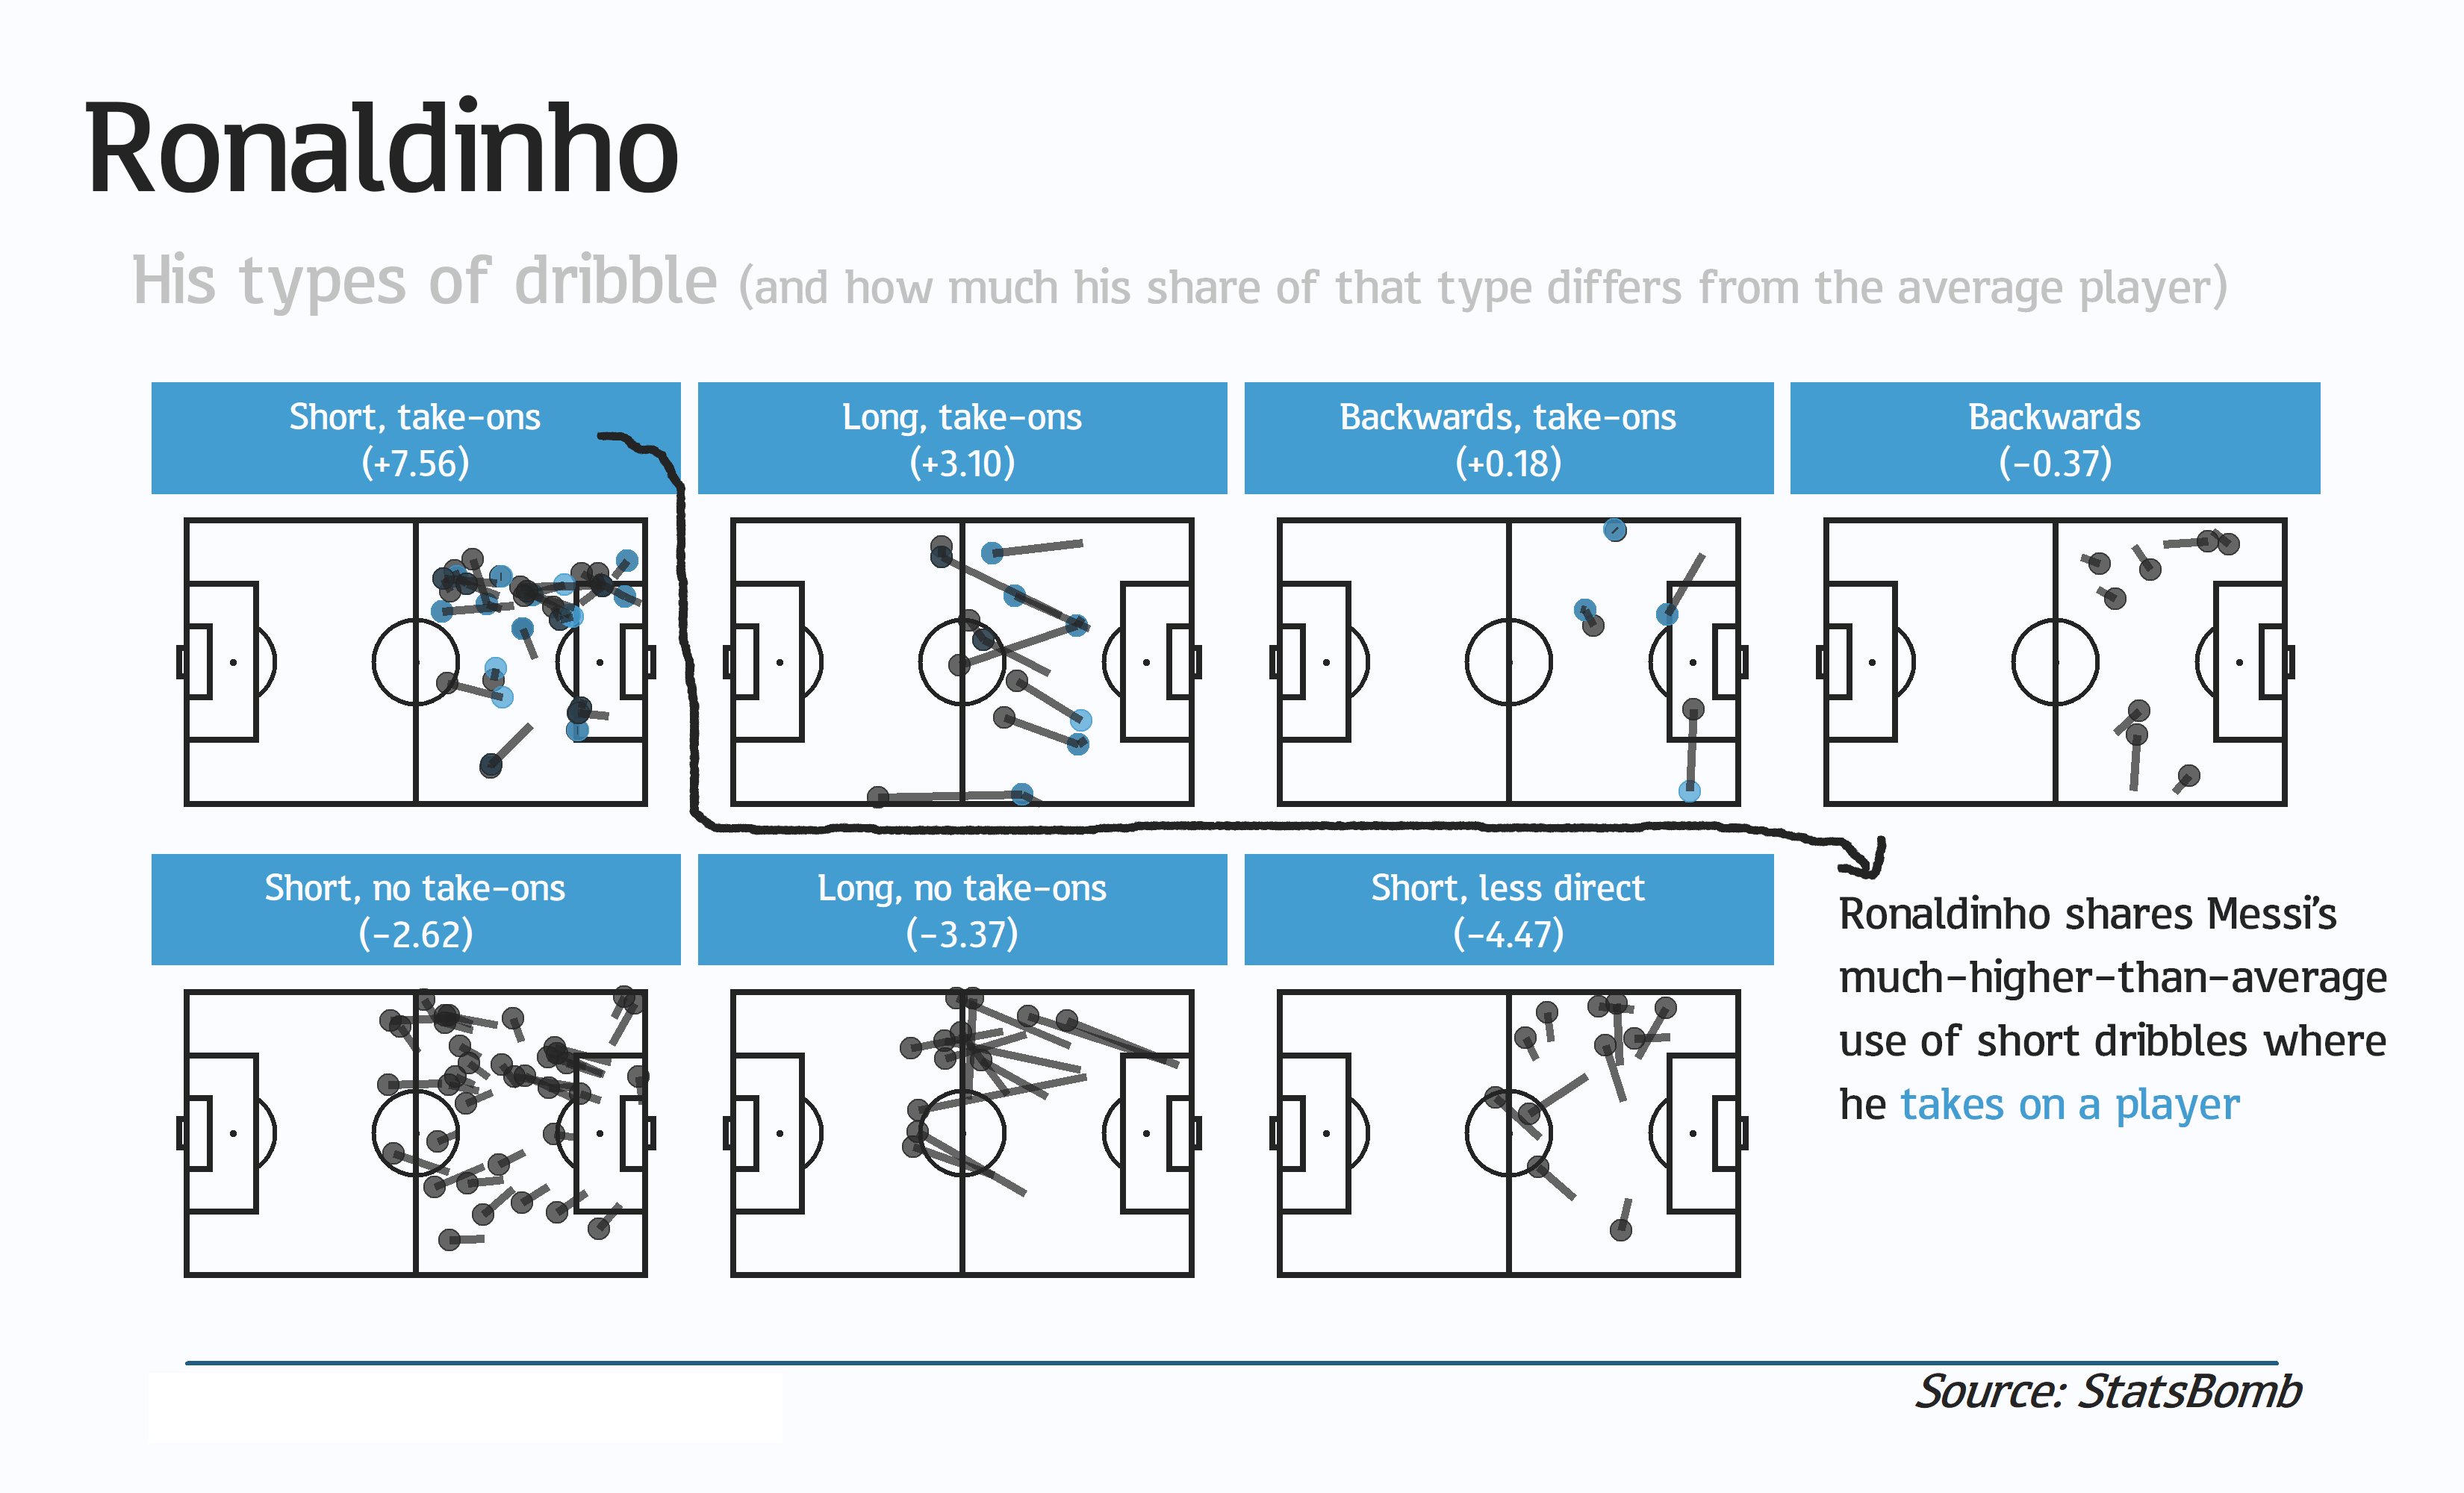
With that information, we can find players who are similarly different-from-the-average. We can see that Ronaldinho shares Messi's relative propensity for short carries with take-on events, even though these seem slightly different (less central) than the Argentine's.
 |
There are, however, some downsides to these results -- at least, compared to my starting idea. It turns out that the location of the pitch and the type of dribble are pretty strongly connected (although in hindsight this seems obvious to say). Longer dribbles, by necessity, are more likely to start from deep; take-on carries are likely to happen high up the field or close to the wings. It's therefore unlikely that I'll find a weird central midfielder who just so happens to dribble 'like Messi' in the centre-circle.
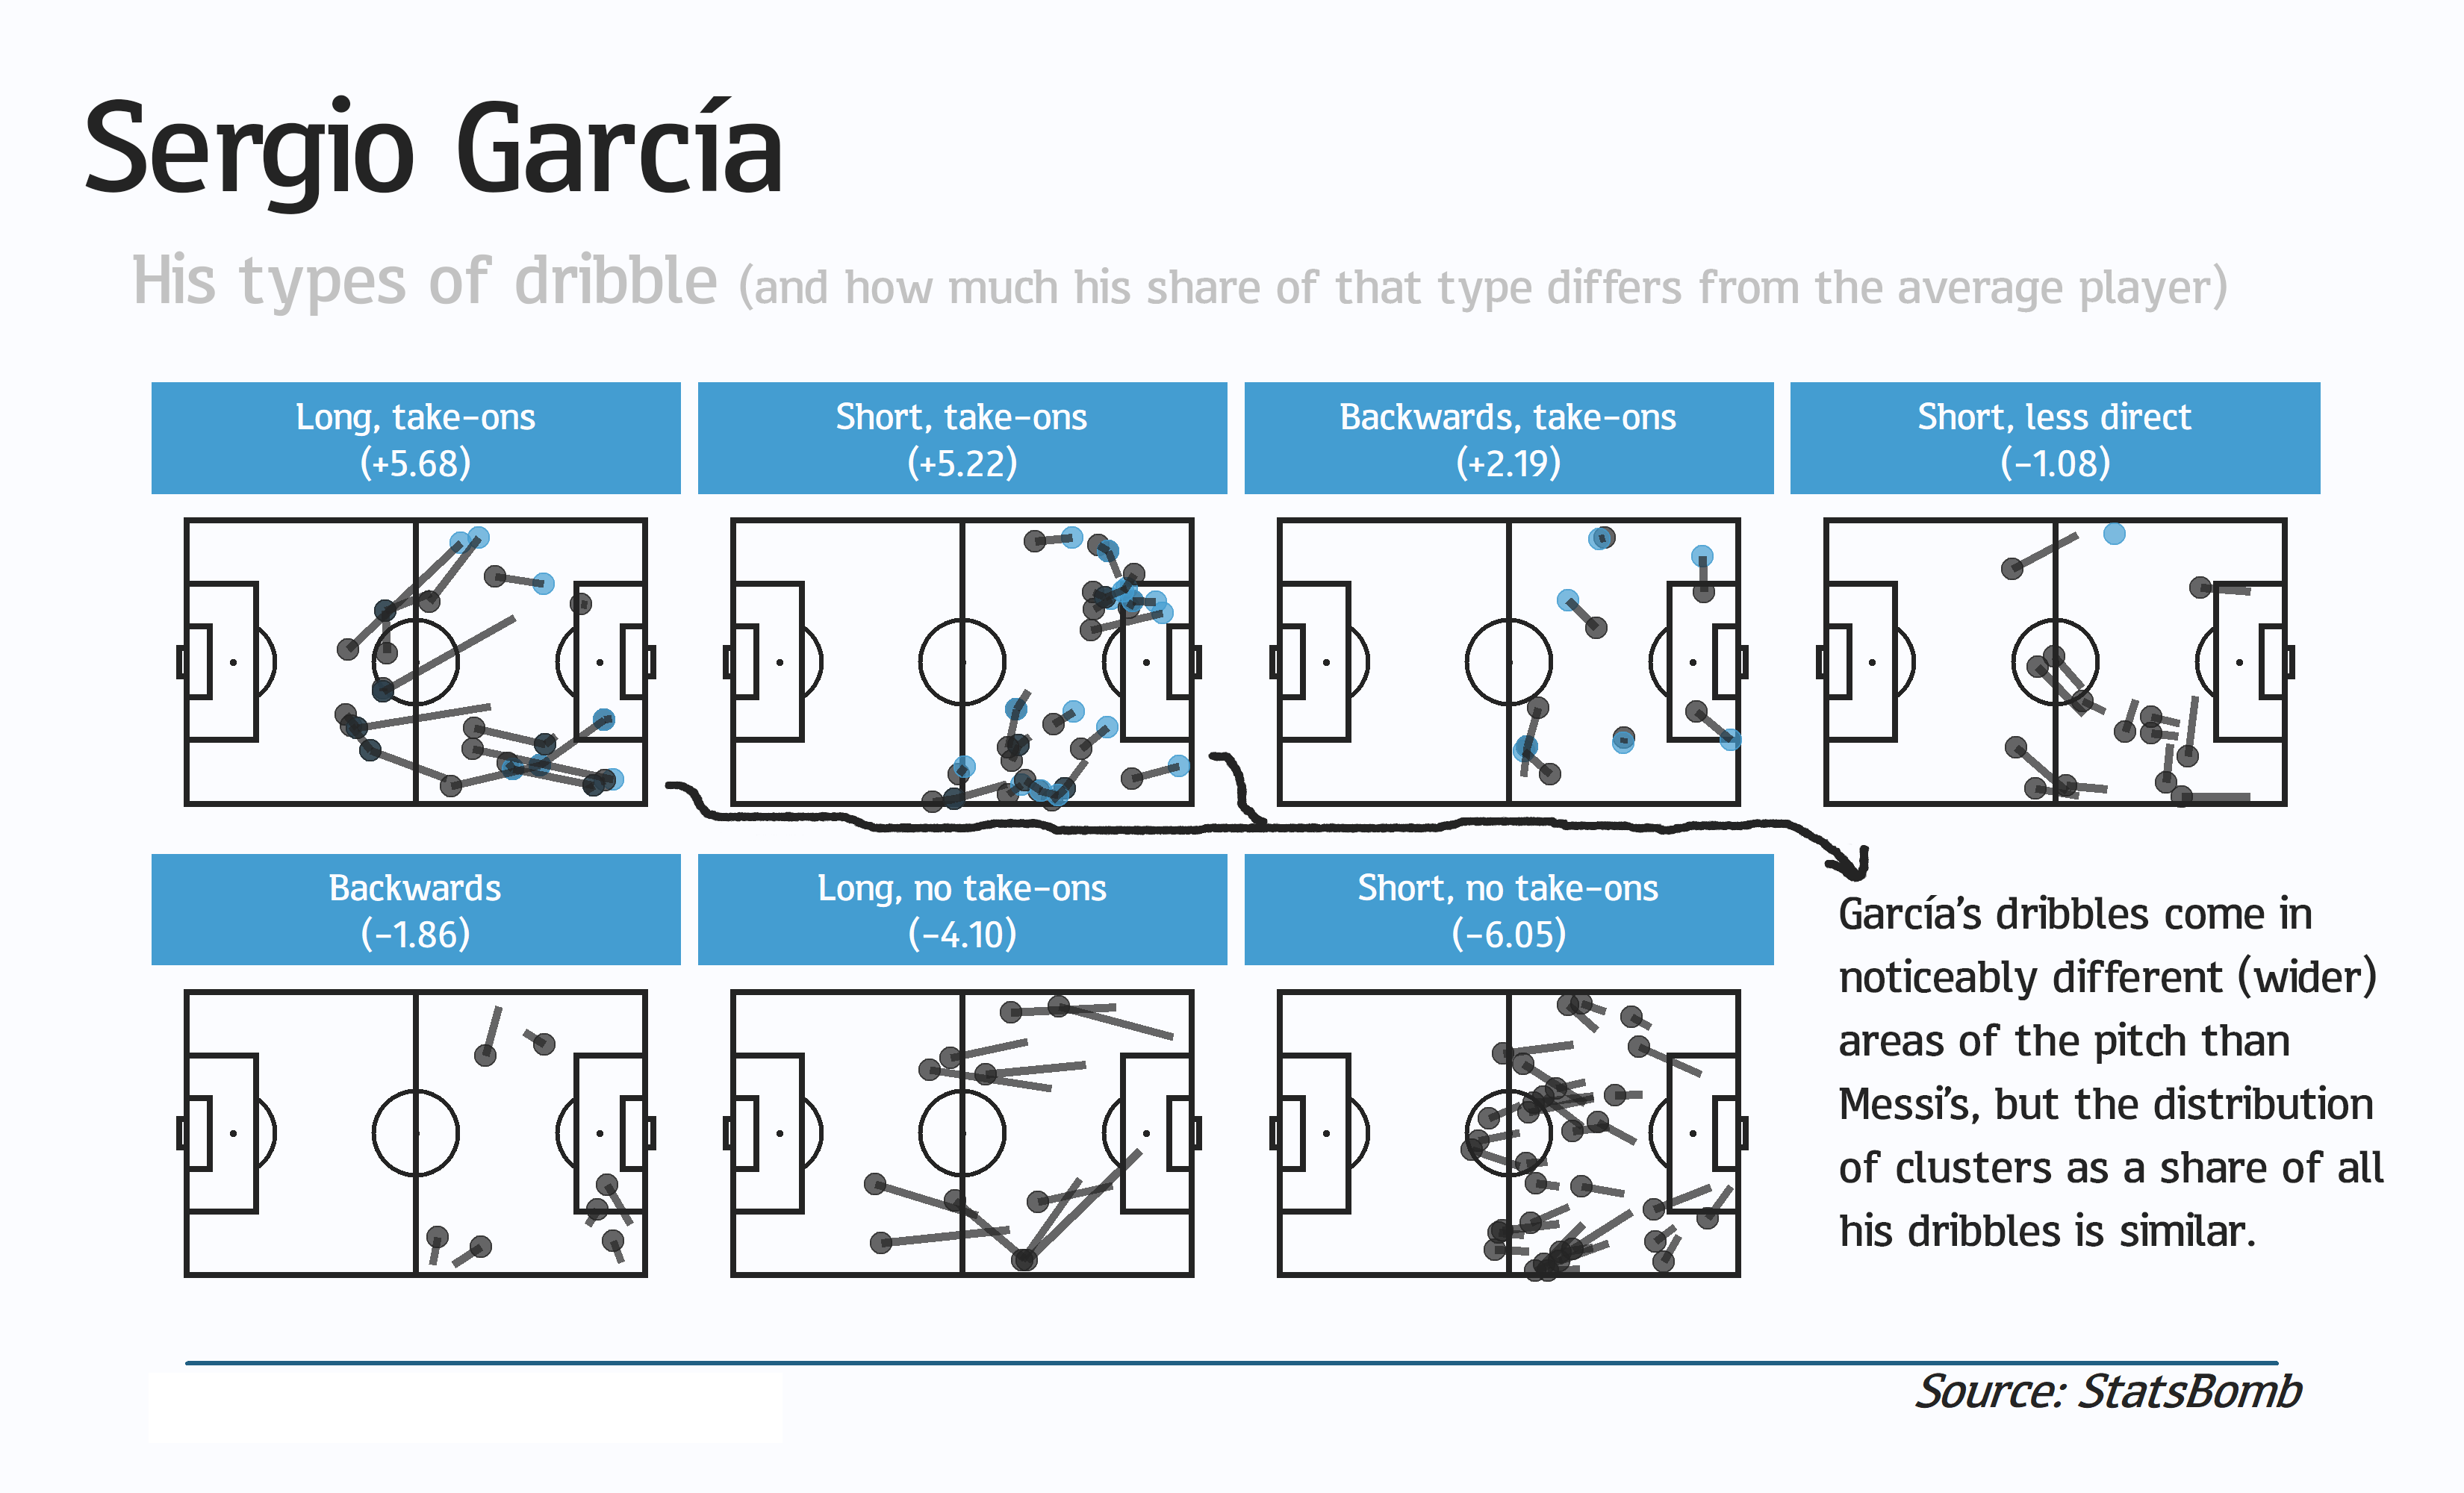
However, it's still fun playing around with the results. The next person on the list[4] is one who wasn't a teammate, Sergio García (not the golfer). He only made 123 carry sequences when playing against Messi, but those 123 had a similar balance of types.
 |
Despite the downsides, these clusters do achieve much of what I wanted them to. They seem to cover the different types of dribble enough, although I'm sure they could be improved upon. They're also pretty simple to understand, such that I was able to give them short names to put in the graphics' headers.
Perhaps if doing it again from scratch I might take out take-ons as a feature of the clustering. Although it's something I associate with Messi, I'm not sure how I'd characterise the difference between take-ons of a similar length with and without them. (The number of pressures encountered on the route might be a more interesting/worthwhile factor here).
This is, in the end, a reminder of the decisions that are made when dealing with data. That just because something has involved an algorithm, doesn't make it an objective truth. There are always touches of the analyst in there. In some cases, even (not mine), touches of the artist.
[1] || "...The number of take-ons in a sequence of ball-carrying" || StatsBomb's data has 'Carry' events which start in one location and end in another as well as 'Dribble' events, which are the moment of a take-on. For this analysis I strung these together where applicable, i.e. if a player carried the ball, completed a dribble, then continued onwards this all became one 'carry'
[2] || "...Whether the carry was 'long' or 'short', decided somewhat arbitrarily as a carry over 20 yards or not" || To be honest, 'yards' is a bit of a fudge here. I intended to convert StatsBomb's 120x80 coordinate system into the dimensions of the average/FIFA standard pitch (105x68 (which is metres anyway not yards)), but for various reasons I didn't get to it. The principle of above/below 20 'units' of measurement applies.
[3] || "So: number of take-ons[...]; directness; long/short." || I should also add that there were a couple of other filters I used for my clustering. Carry sequences had to be five 'units' or longer (see [2]) OR have at least one attempted dribble event in them. They also needed to end in the opposition half. I realised quite early on that including carries in the defensive half, where teams are usually under much less pressure, massively skewed things in a way that was very far away from what I was interested in.
[4] || "The next person on the list..." || I limited the results to players who had 50 or more carry sequences in the dataset. Bear in mind that these are matches played with or against Messi in La Liga, so non-Barça players will probably have needed to play several matches against Barcelona to qualify.